European Natural Gas Market - Episode 1
Are we in a seasonal bull market for TTF? 19 November 2024
As some of you who follow us on Twitter (X) know, we have been tracking the European natural gas market in detail as part of our long/short investment approach for years. In a way, we are a big data company in certain commodities, as you will hopefully agree soon.
While Burggraben usually does not trade Title Transfer Facility (TTF), we are keen to understand its direction as part of our fundamental investment approach. Predicting TTF means to understand the intrinsic value of certain Oil & Gas, Coal and Utility stocks and their traded debt. Of course, it also means to better understand the cost structure of certain energy-intensive industries in Europe.
The Basics
Let’s take a look at the European Natural Gas Market. Let’s go through the basics first, so that we can refer to them in future episodes and in order to level the playing field for our readers:
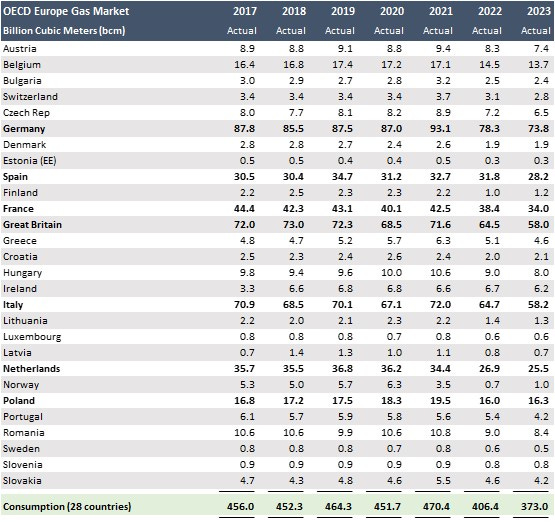
Perimeter: When we talk about the European Natural Gas Market, we refer to 28 countries including Switzerland, the Scandinavian countries, the United Kingdom and Ireland. We exclude Serbia and Turkey as they do not participate in our demand-supply balances relevant for the European Hub Price. Note that the eight largest markets - the big 8 - account for 82% of demand, while the top eighteen markets represent 97% of demand.
Net Importer: Europe is a 450 billion cubic meter (bcm) natural gas market. Prior to the COVID-19 pandemic and the Ukraine war, 45% of its consumption was produced locally. The rest was imported from Russia, Asia and North Africa, as well as in the form of Liquefied Natural Gas (LNG) via tankers from global suppliers.
Consumption Types: About 65% of European gas use is consumed by households (which includes retail), mainly for heating in winter but also for cooking. The European industry consumes another 20%, while 15% is used for electricity generation. Household consumption, managed by Local Distribution Companies (LDC), is highly seasonal and correlates with temperatures, as we will illustrate below in more detail. Most European housing consumption occurs in December, January, and February, although winter in certain countries lasts from October to April.
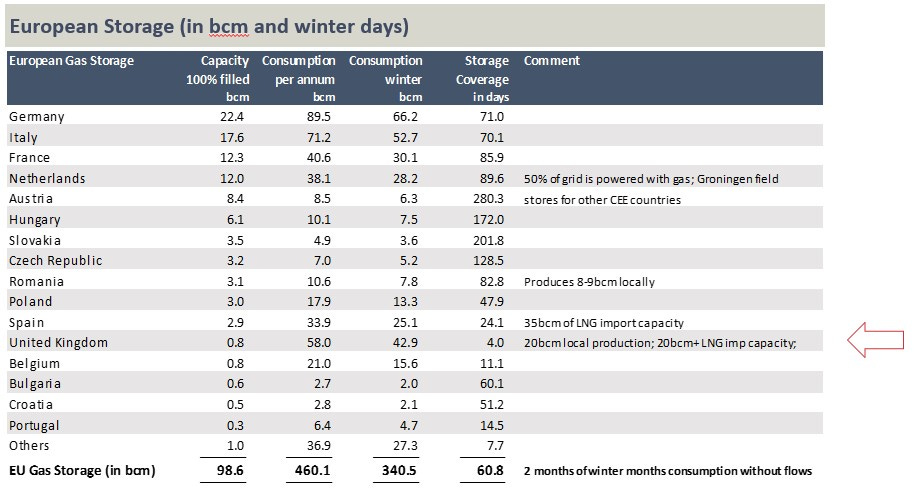
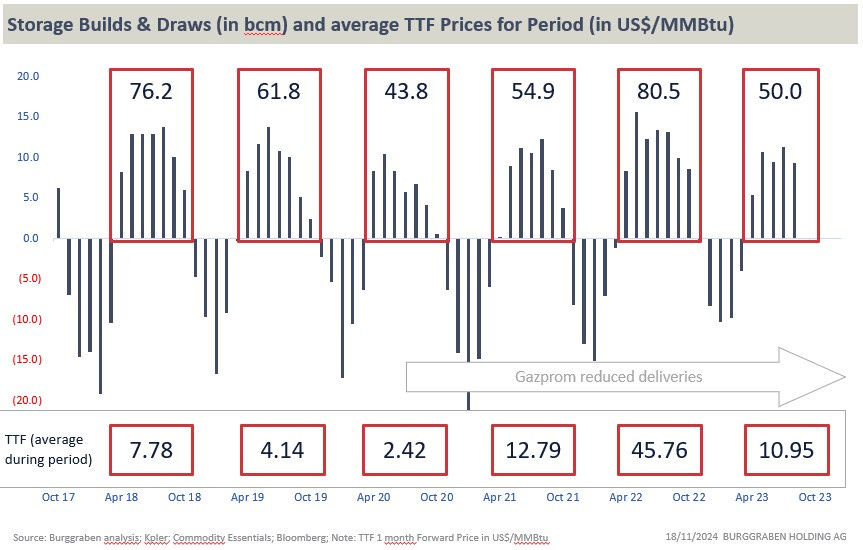
Storage Cycle: Between January 2017 and December 2021, European supplies averaged 38 bcm per month. During this period, consumption per month was as little as 23 bcm and as high as 65 bcm. This means that the month of lowest consumption was 40% smaller than the average monthly supply, while the month of highest consumption was 71% higher. The difference goes into and comes from storage. Therefore, Europe injects gas during summer summer months (when temperatures are above 10 degrees Celsius) and withdraws gas from storage during winter months.
Price Formation: Since the liberalization of the European gas market, TTF has become the hub price that drives all other regional markets such as NBP in the UK, THE in Germany, or Baumgarten in Austria.
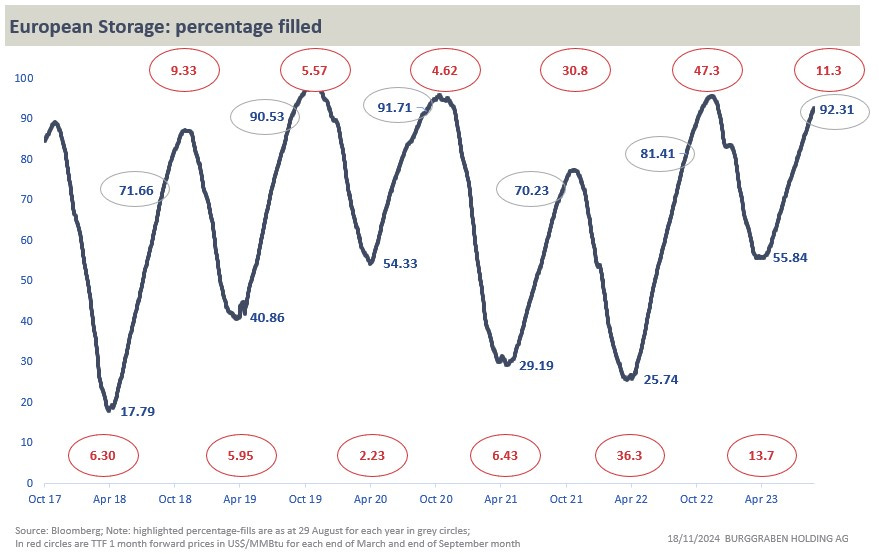
In general, there is a good relationship between storage filled and TTF prices: when European storage levels decline faster than normal during winter months (it is a relative relationship), prices go up. When European storage levels decline more slowly than normal, prices go down. Similarly, when storage fills quicker than normal in the summer, prices go down and vice versa.
Of course, TTF will also react to other news but that is for later episodes.
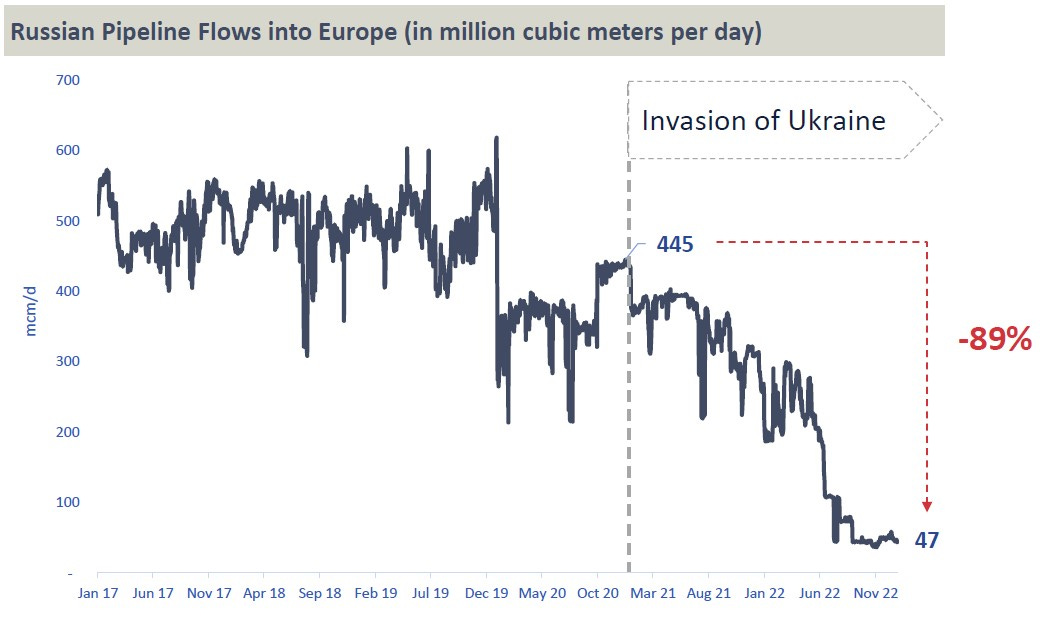
Gazprom Crisis: In 2019, a peak year, Europe imported 171 bcm from Russian pipelines and LNG facilities, accounting for 37.1% of its total consumption. This share had fluctuated between 28% and 37% in previous years. However, Russia (Gazprom) unilaterally reduced such supplies to Europe during 2021 & 2022.
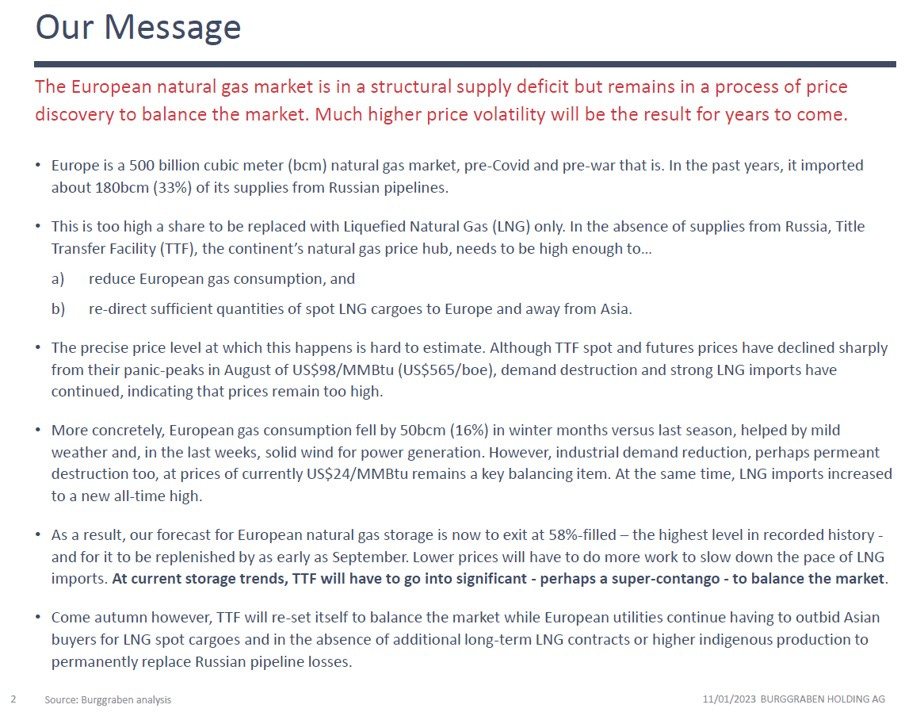
Discovery Process: Russian gas had too high a share to be replaced with LNG alone. In the absence of Russian supplies, TTF, the continent’s natural gas price hub, needed to be high enough to …
a) reduce European gas consumption, and
b) re-direct sufficient quantities of spot LNG cargoes to Europe and away from Asia.
In other words, and as we like to say, the price has to do the work as commodities do not discount the future but instead, trade in the present on the basis of demand and supply imbalances!
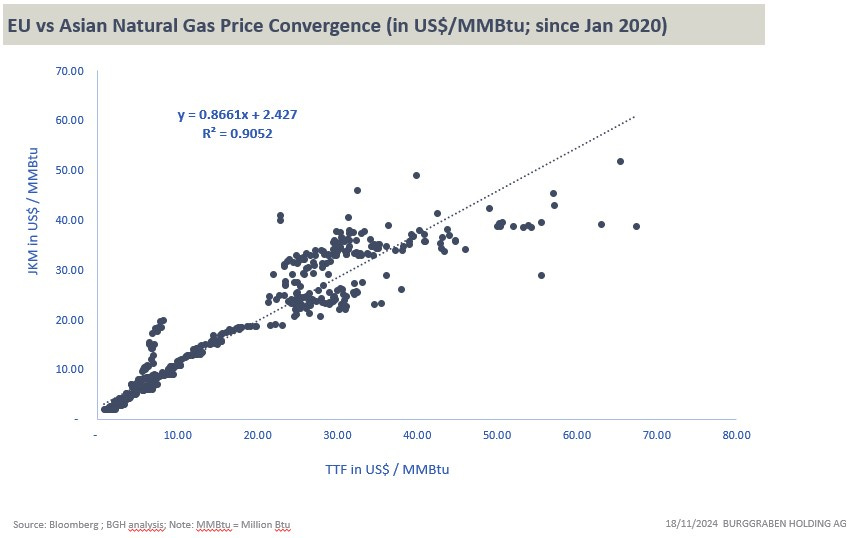
Price Convergence: Europe now competes with Asia to secure the marginal LNG molecule in order to balance its market. Consequently, prices for EU natural gas (TTF) and Asian Japan/Korean Marker (JKM) have converged as both regions compete for LNG from key supply regions in the US, the Middle East, and Australia.
Volatility: The precise price range at which this happens for each year remains hard to estimate as we entered a new regime for TTF post-Gazprom supplies. For instance, during a January 2023 conference call with Jefferies (the US investment bank) clients, we stated the following:
Our bearish forecast for European natural gas prices in winter 2023 proved correct. EU storage levels reached 59.23% at winter’s end - the highest ever in history - while TTF prices fell by 65% between early January 2023 and the end of May 2023.
General Observation: If we understand European gas prices, we often understand the direction of European electricity prices and global coal prices.
Data Quality: We want to develop the best possible database on European gas. We use high frequency data sources to analyze the European gas market:
Commodity Essentials, for daily natural gas data, which in our view is the gold standard and which consolidates its data for all countries daily (!).
OilX satellite data and Bloomberg Terminal data for LNG data.
Bloomberg to download daily weather data from various models, as well as other news services to monitor unstructured data such as news.
Note that all these data are subscriber data only. So we hope you appreciate why we are not passing on such data going forward to free subscriptions.
Also please note that, over time (we have been doing this for years) we have observed that some data services do not provide accurate data. This is particularly problematic in commodity markets, as commodities price everything at the margin. One might as well not “do data” at all if the data is wrong, and thus useless.
Let us now look at the market as we see it today, based on our model that we have fine-tuned over the years.


