

EU Natural Gas Deep Dive: Cheap Gas, Fragile System
Europe’s Post-Gazprom Energy Regime Needs Further Repair


Europe’s Post-Gazprom Era: Cheaper Gas, Uneven Access
The European natural gas market is structurally in a bear market. That is unequivocally good news for European consumers. Yet it remains vulnerable on a country-by-country basis for reasons we will lay out in this Substack.
In other words, the Title Transfer Facility (TTF) should remain around current levels of roughly US$11/MMBtu, or about €33/MWh, and likely below that well into 2030. But that only holds if European utilities avoid the complacency we witnessed in Q3 2025, when time spreads were mistaken for certainty, and weather forecasts were treated as guarantees rather than probabilities.
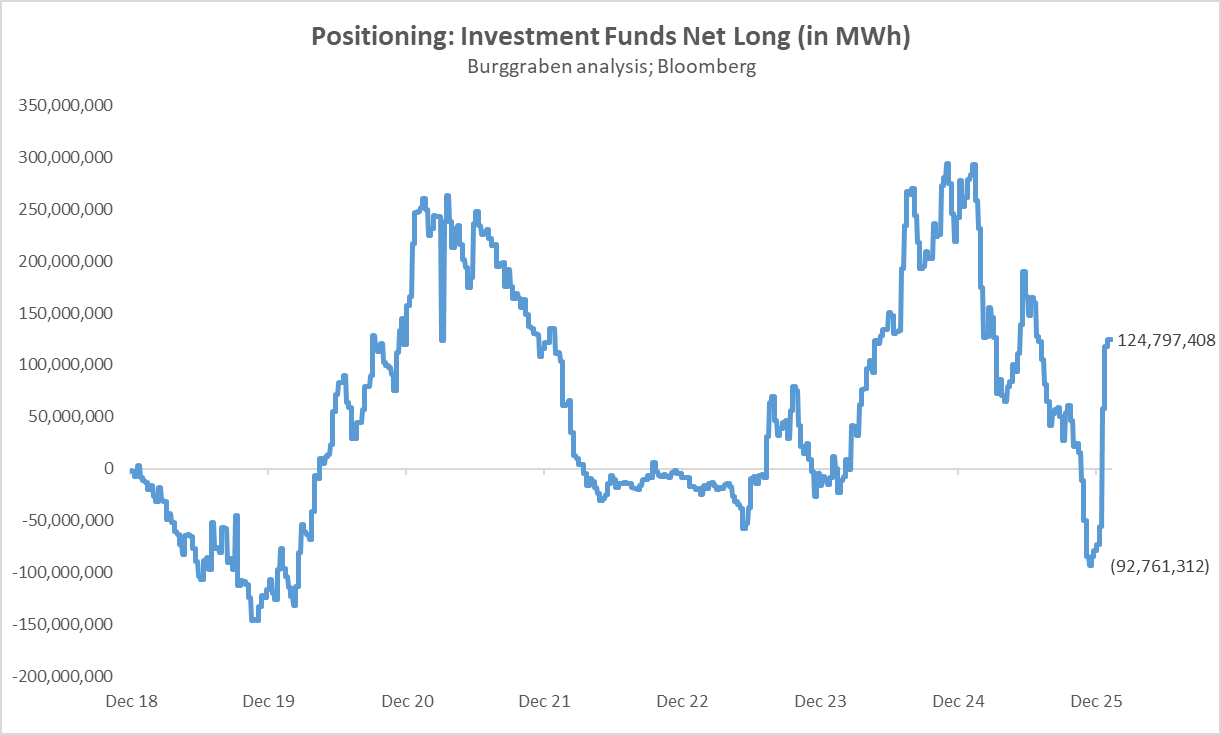
That country-level vulnerability explains the abrupt shift in speculative positioning in January 2026. Within days, the market flipped from net-short 92TWh to net-long 124TWh, as illustrated below.
Colder-than-expected January weather suddenly made Europe’s otherwise manageable storage levels look precarious for March 2026.
At the end of October, in my Substack titled “The Calm Before the Thaw: Europe’s Natural Gas Market Finds Its Balance”, I argued that an 81% storage level across Europe was sufficient to keep TTF contained, given weak Chinese and Japanese LNG demand.
That call proved directionally correct. But today I want to refine it — from a country-by-country perspective and in light of the awkward distortions now visible in parts of the European gas market.
Before we dissect those vulnerabilities, we must first revisit our gas model and examine how fundamentals have shifted since our 31 October 2025 forecast.
Fundamentals First
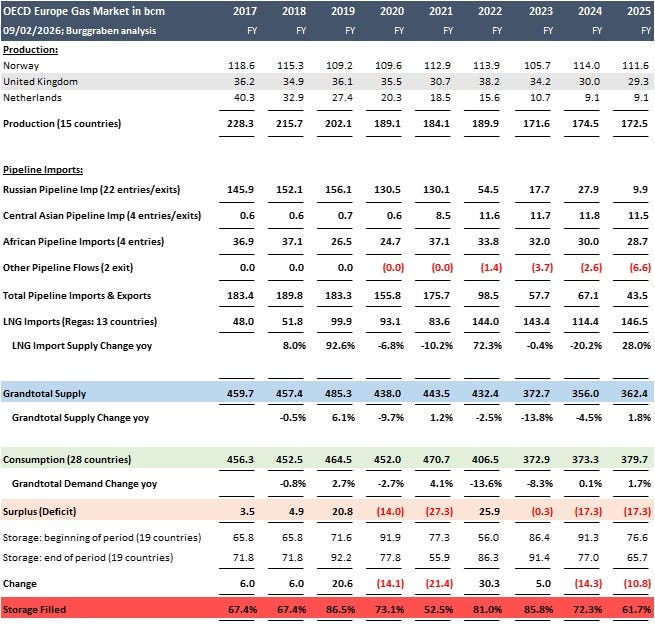
Back in October, we forecast a European exit storage level of 20.9% by the end of March. Based on the latest weather data as of yesterday — with November, December and January now fully incorporated and limited moving parts left for February — our model now suggests an exit level of 16.8%.
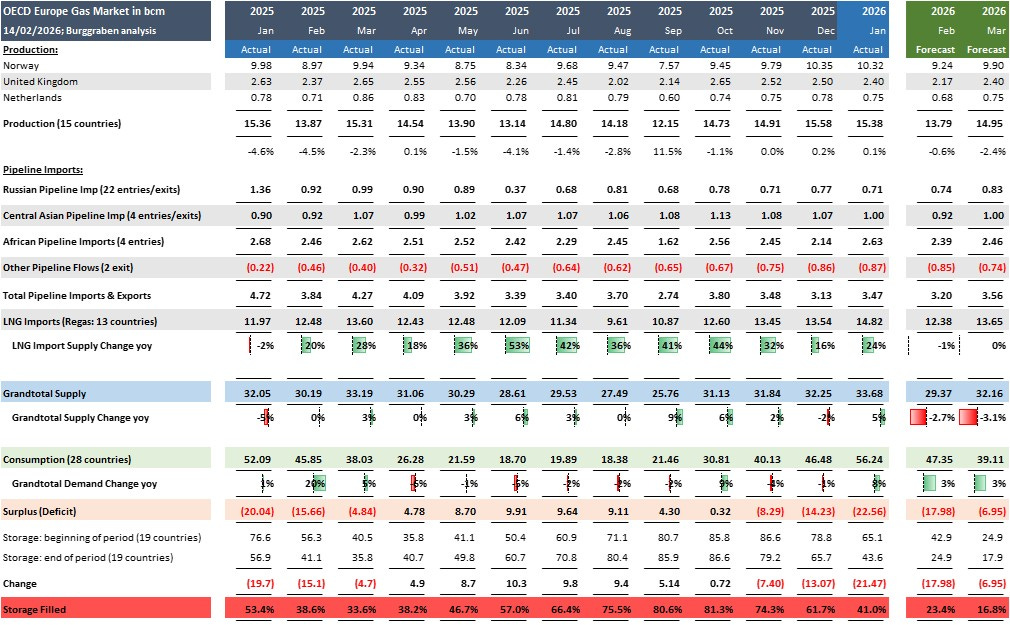
For our purposes, Europe comprises 28 geographic nations: all 27 EU members excluding Malta and Cyprus, plus the UK, Switzerland and Norway. This is the relevant demand–supply perimeter for the formation of the Dutch Title Transfer Facility hub price, better known as TTF.
Bifurcated Storage Levels
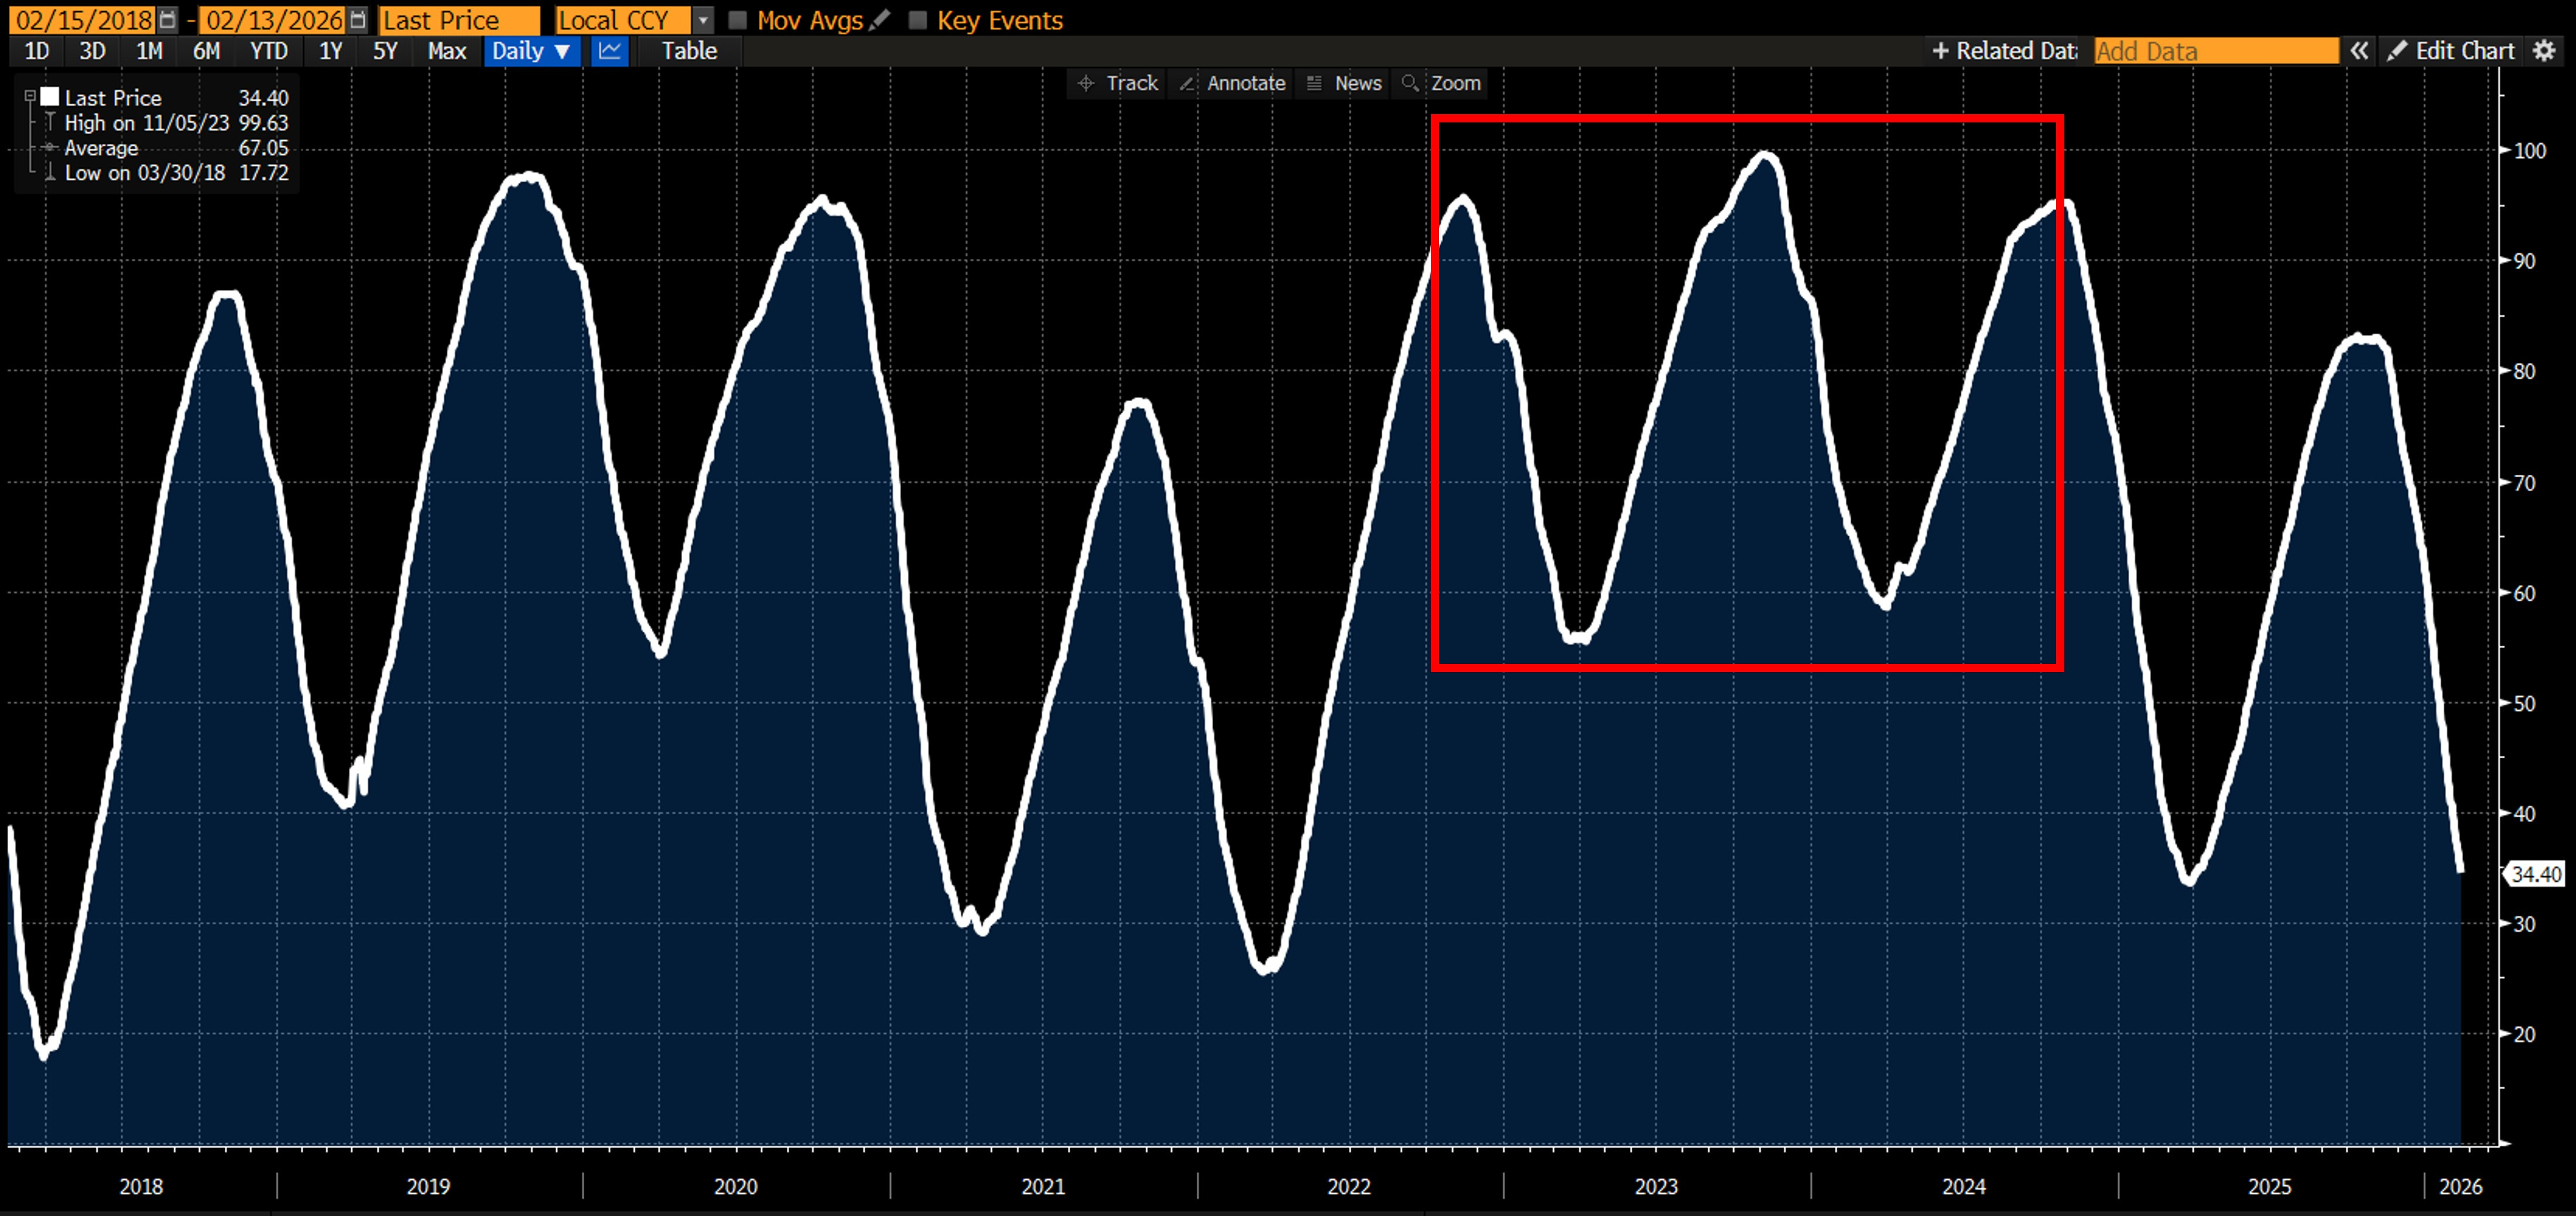
An exit level of 16.8% would mark the lowest in a decade. Ordinarily, that would justify higher prices, not the softer tone we observe today.
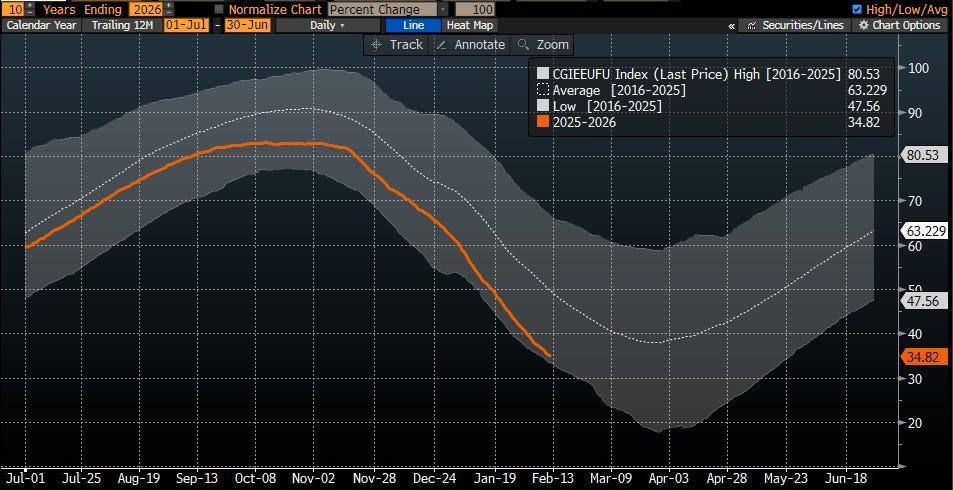
More importantly, 16.8% would be by far the lowest exit level in what we call the Post-Gazprom era, as the second chart illustrates. Whether the final number prints at 17%, 18% or even 21%, it will still represent a new record low for this regime. That much is already clear.
And the situation is worse than the European average suggests.
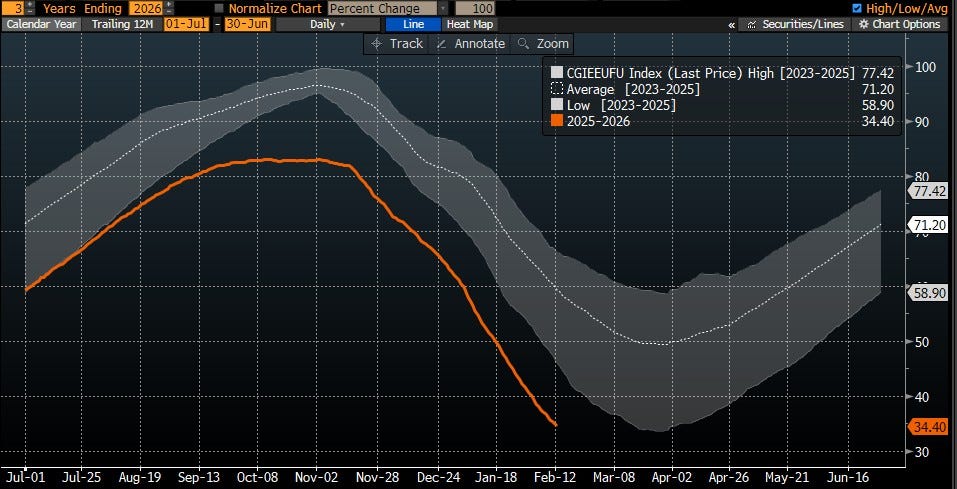
Italy, Europe’s second-largest storage holder at 18.8bcm, sits in a comfortable position at 51.8%-filled (green line). Germany (yellow line) and the Netherlands (blue line), by contrast, are materially below the European average (orange line), at 24.8% and 17.0% respectively.
In other words, Italy’s healthy position flatters the continental average. North-West Europe looks stronger on paper than it is in practice.
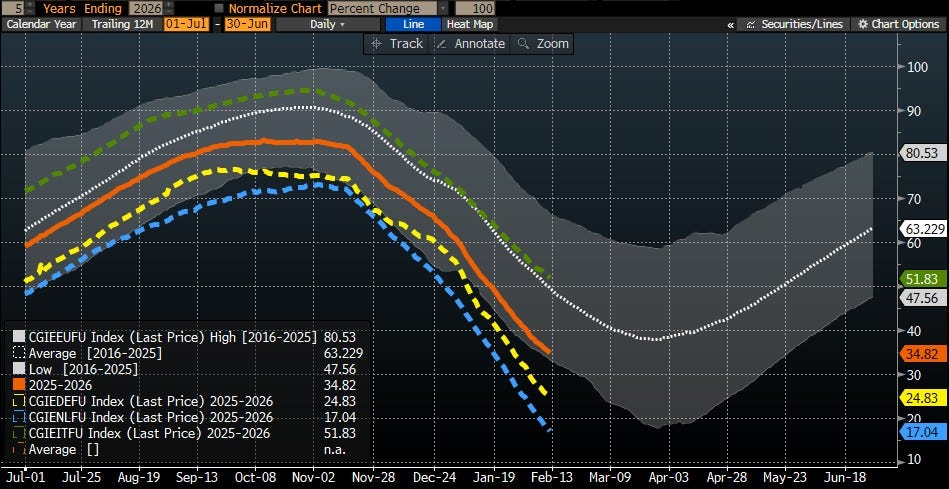
Germany holds the largest storage capacity in Europe at 23.3bcm. The Netherlands ranks third with 13.4bcm. What happens in these two countries alone will largely determine Europe’s supply security next winter.
TTF Doesn’t Seem to Care
And yet, TTF barely moves.
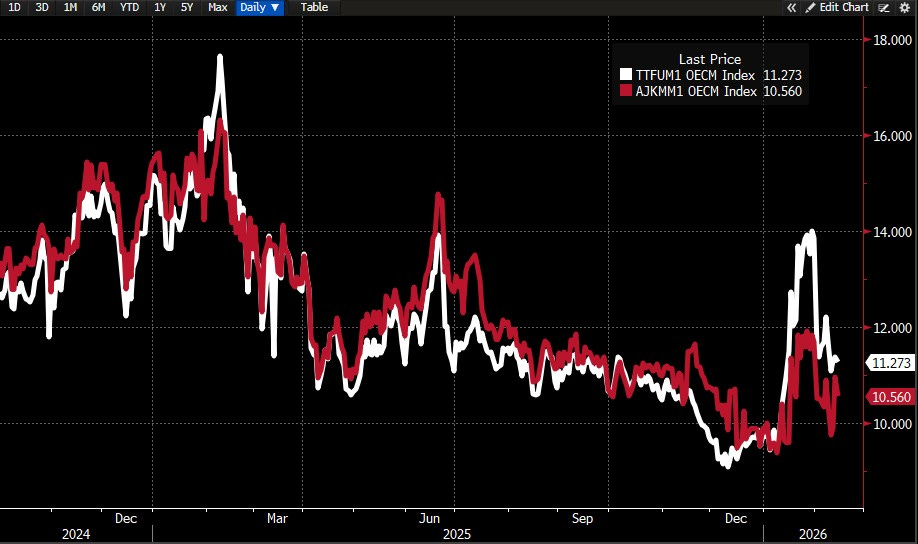
It is down 21% from its brief January spike, when prices jumped from US$9/MMBtu to US$14 on a colder-than-normal forecast and heavily short speculative positioning. Once shorts covered, the spike followed.
With February now turning milder, TTF 1M forward futures hover again around US$11/MMBtu, only marginally above its Asian sibling, the Japan–Korea Marker (JKM).
Once April 2026 closes the books on winter, TTF will likely have traded within a US$9–11 band for most of the season, January aside. That is a far cry from the volatility seen post-summer 2023, let alone during the immediate Gazprom crisis of 2022.
Since liberalisation, TTF has become Europe’s reference hub, driving regional prices such as NBP in the UK, THE in Germany, Baumgarten in Austria, PSV in Italy, ZTP in Belgium and PPX in Poland.
Storage levels and TTF prices typically move in a clear relative relationship. When winter drawdowns are faster than seasonal norms, prices rise. When drawdowns are slower, prices ease. In summer, faster-than-normal refill suppresses prices, while slower refill lifts them. That framework still holds, but it is not the only force at work, as we will see.
Timespreads Matter Most
Daily price behaviour becomes far more instructive when looking at the futures curve and time spreads.
In theory, summer contracts should trade below winter contracts. That positive spread allows utilities to buy gas cheaply in summer, inject into storage, and sell higher in winter — covering storage fees, logistics and financing costs.
For summer 2026, however, the January 2027 minus July 2026 spread offers a mere US$0.53/MMBtu. That is better than the negative spreads seen during summer 2025, but far below the US$2/MMBtu that prevailed through much of winter 2023/24 and that the market likely requires to function normally.
Is US$0.53 enough to refill storage to the cavern top this summer? Not where regulators have failed to fix the structural distortion.
Let me explain.
Outdated EU Storage Regulation
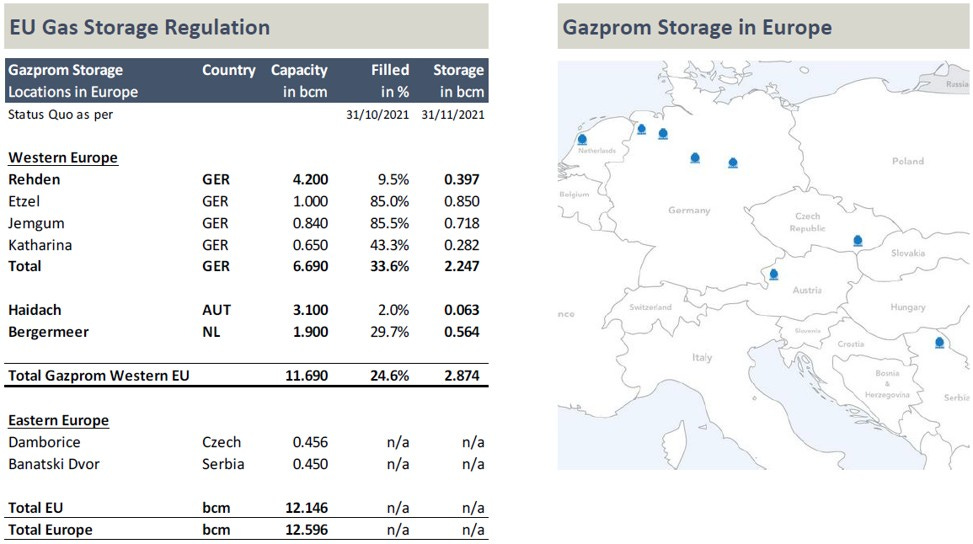
In 2023, following the Gazprom crisis, the European Commission mandated minimum storage levels. That decision was understandable in the immediate aftermath of Russia’s deliberate decision not to refill its European storage sites in 2021 ahead of the invasion of Ukraine.
At the time, I pointed out rather clearly that Gazprom’s European storage levels were collapsing. Few listened. Gazprom claimed it was not in breach of contractual obligations. The rest, as they say, is history.
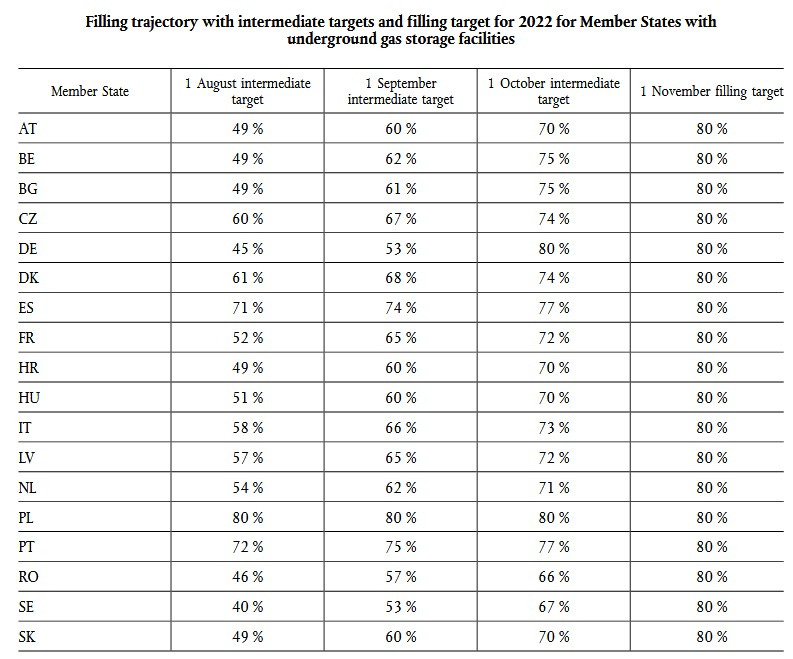
The new Gas Storage Rules (2023–2027) required storage to reach 90% by 1 November. In June 2025, that target was lowered to 80%.
Such intervention was arguably justified in crisis mode. But over time, rigid monthly targets distorted price signals to the point where storing gas became uneconomic.
The regime effectively created a forced bid for summer molecules: market participants must hit a calendar target, regardless of curve economics.
The June 2025 reform acknowledged the distortion and introduced flexibility: the target could be met any time between 1 October and 1 December, with up to 10% deviation allowed under “unfavourable market conditions,” meaning negative spreads.
It did not go far enough.
During winters 2022/23 and 2023/24, Europe was bailed out by mild weather. Many convinced themselves that structural risk had vanished. Winter 2024/25 and again 2025/26 proved otherwise. In summer 2025, European storage averaged 33% depleted. By October, levels recovered only to 82%, well below the previous 90% target.
The curve explained why. Buying high in summer and selling lower in winter locked in day-one losses of roughly US$1/MMBtu — at times equivalent to €3.5–7/MWh. That is not a functioning merchant signal.
Too Little Too Late?
The June 2025 reform improved flexibility, but not incentives.
The Netherlands entered winter 2025/26 at 73%-filled on 7 November — roughly 3bcm below capacity. Germany entered at 76%, around 6bcm below capacity. That is 10bcm missing from two countries alone before winter even began.
Austria was at 85%. Hungary at 73%. Meanwhile Italy entered at 94%, France at 93%, the Czech Republic at 93% and Poland at 100%.
Same EU regulation. Different outcomes. Why? Local incentives.
Italy did not rely on the futures curve to solve the problem. It’s regulator introduced a policy-backed premium mechanism, explicitly recognising that the spread was insufficient. Estimates discussed levies around €2.19/MWh to compensate injection economics — effectively a policy-implied minimum storage premium.
France operates under a more infrastructure-like regulatory framework. CRE has publicly stated that its storage regime functioned effectively in 2024 and early 2025, though without explicitly detailing the compensation mechanics.
Germany and the Netherlands, by contrast, operate predominantly merchant storage systems. Gasunie publicly acknowledged that summer–winter spreads were too thin, making it more attractive for market participants to resell molecules rather than store them. Similar comments emerged from Germany during summer 2025.
We estimate merchant storage requires €2–3/MWh spreads to clear. One year ago, the curve did not offer that. It did not offer it through most of summer either. October storage levels in Germany and the Netherlands confirmed the result.
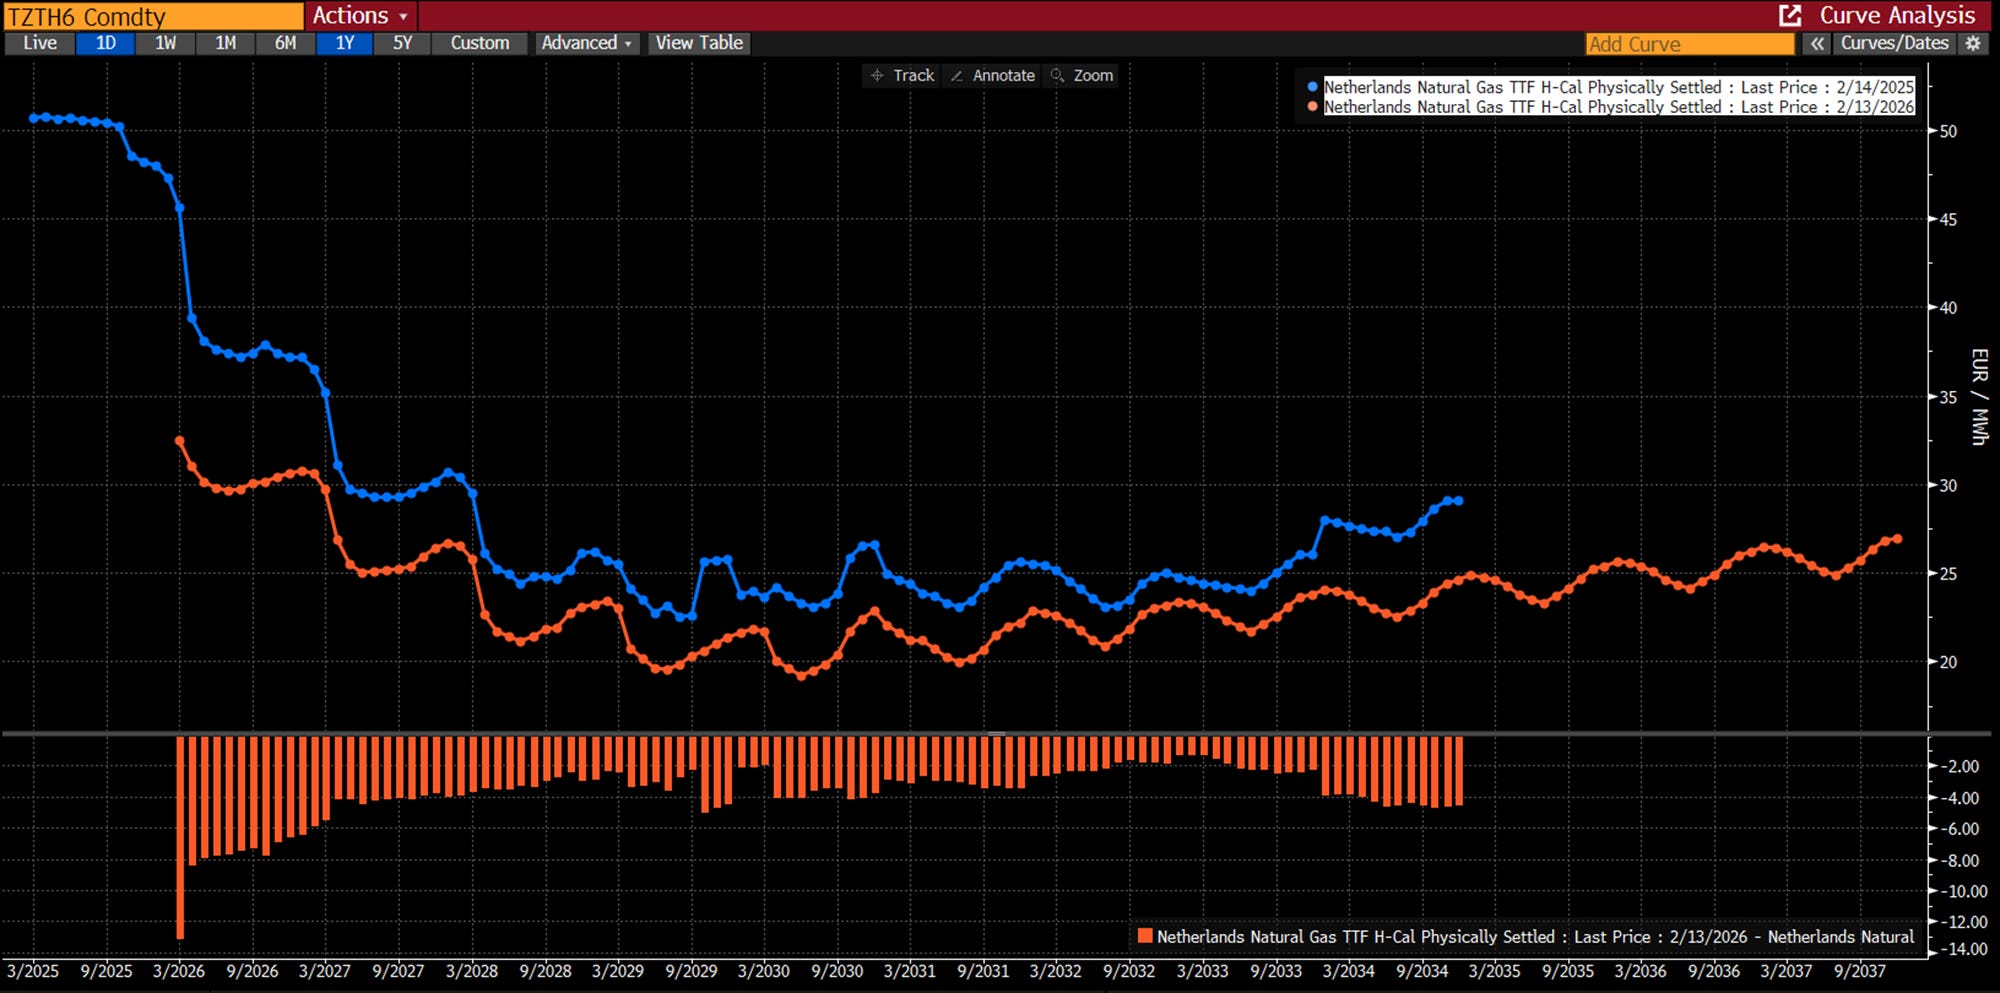
Yes, today’s curve (orange line) has improved. But incentives likely remain insufficient for Germany and the Netherlands to refill above 80% — levels these countries arguably require in the Post-Gazprom regime to navigate winter safely.
Two Sundays ago, when February weather forecasts turned colder for North-West Europe, our model immediately exposed the gap. Under that scenario, at least one of Germany, the Netherlands, Belgium or Slovakia would have approached critical storage depletion by March, depending on LNG arrivals.
That is absurd. Europe requires 90%+ storage entering winter. Period.
Unless German and Dutch regulators introduce an Italian-style incentive mechanism soon, expect refill levels to disappoint again by October. Either regulators compensate the curve distortion they helped create — effectively paying an insurance premium for consumers — or they scrap rigid storage targets altogether and allow the curve to clear naturally.
One way or another, the distortion must go.
LNG Glut Reflected in the Curve
The futures curve now signals roughly €10/MWh lower prices by 2029 — equivalent to about US$3.16/MMBtu. Why?
As outlined in October, the single biggest comfort factor for future European gas balances is the sheer availability of LNG export capacity coming online. None of that existed in 2022 at the height of the crisis. The picture only improves into 2027 and 2028. For TTF purposes, LNG balances are already edging into glut territory.
Three forces drive this:
(a) LNG Surplus — a classic commodity capex boom–bust cycle triggered by the Gazprom shock;
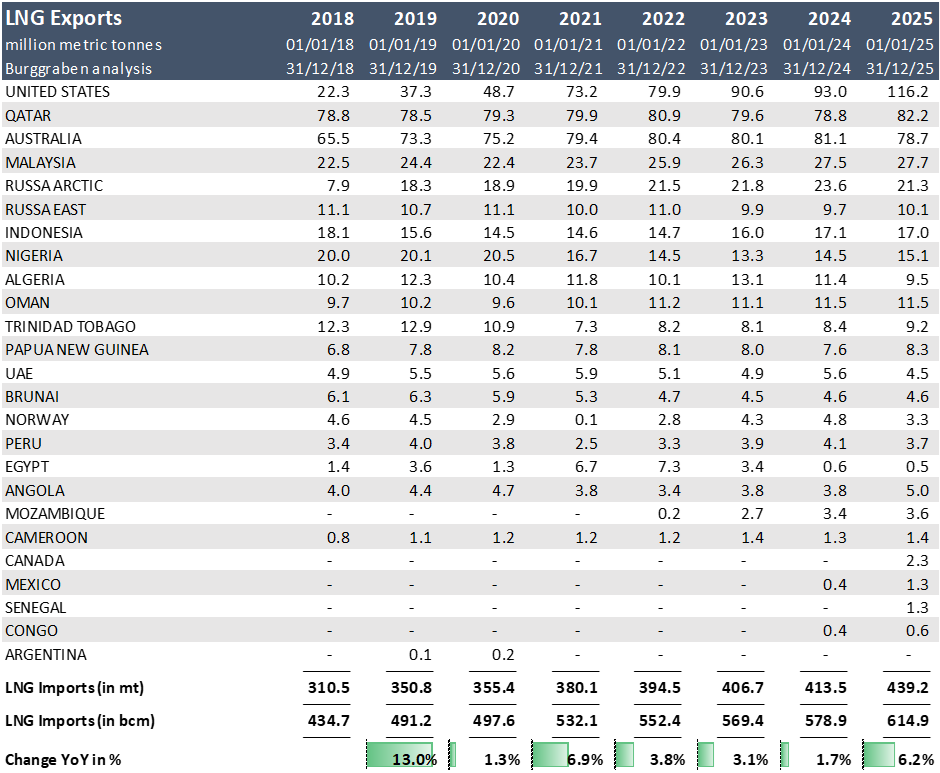
(b) The Chinese Switch — structurally lower LNG imports as pipeline volumes and domestic production rise;
(c) Lower Japanese Demand — nuclear restarts reducing LNG burn.
Let me take them in reverse order.
Japan’s Nuclear Renaissance
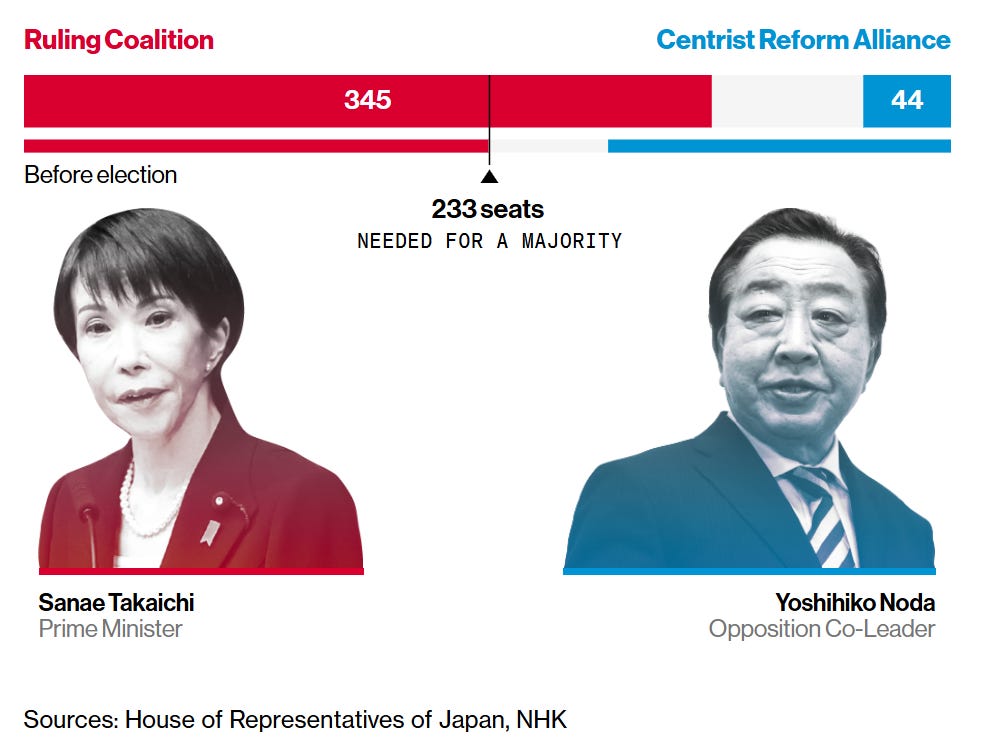
Japan’s new prime minister, Sanae Takaichi, has signalled accelerated nuclear restarts to combat inflation and reduce costly fuel imports.
Will she deliver?
Well, last week her coalition achieved a landslide snap-election victory, securing around 310 seats, a two-thirds supermajority. That political capital should translate into faster nuclear reactivation.
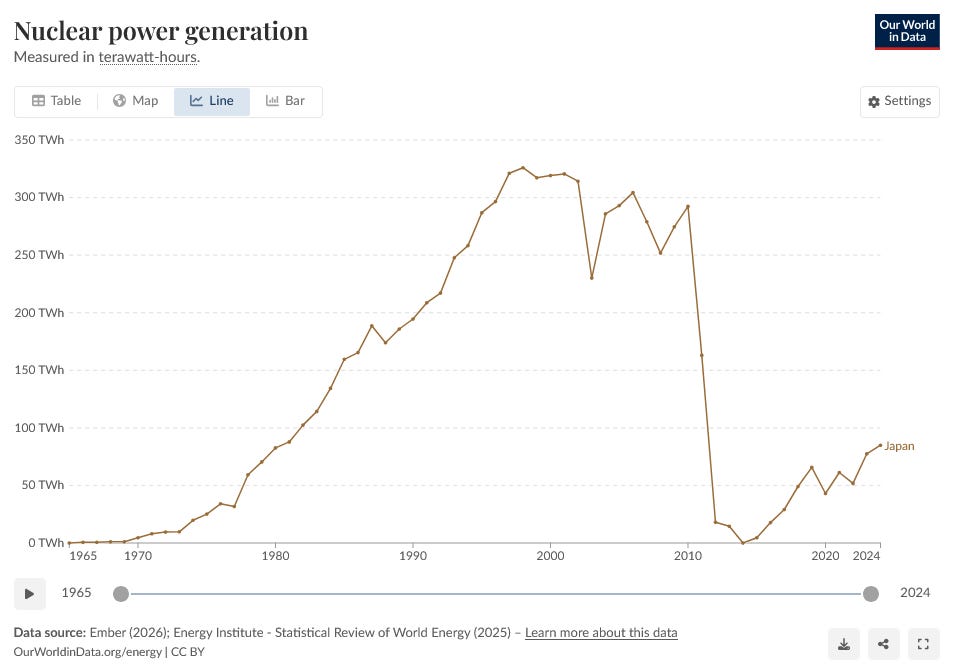
Japan currently derives roughly 8% of electricity from nuclear power. It was 33% in 2000, before Fukushima struck in 2011. If nuclear generation rises even to 15%, with a longer-term policy target of 20% by 2040, that implies roughly 100TWh of additional nuclear output.
The latest proof came last Monday when Tokyo Electric Power Co restarted Reactor No. 6, the nation’s largest unit. With 1.35GW capacity and a 90% capacity factor, it delivers roughly 10TWh per annum.
That alone displaces about 1bcm per year of gas. In fact, each 100TWh of nuclear generation theoretically reduces LNG demand by roughly 9bcm per annum, against Japan’s 65bcm import market.
We will see how quickly restarts materialise and how utilities substitute fuels. But at US$11/MMBtu and with persistent volatility, LNG — not coal — is the obvious target for displacement.
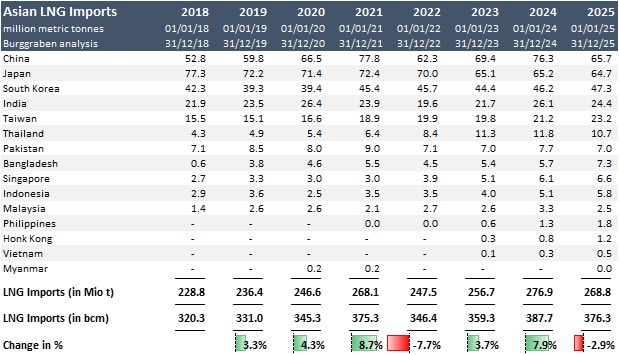
Japan’s stated objective is clear: reduce imported fuel costs in a country carrying 200% debt-to-GDP and now facing inflation after decades of deflation. Japanese LNG imports peaked in 2021. The direction of travel is lower.
The irony? These policy shifts were triggered by Putin’s decision to weaponise gas supplies to Europe in 2021 and 2022 which caused also Asian prices to spike, the key reason for Japan to restart nuclear.
Meanwhile, the 150bcm removed from Europe did not disappear; some of it is now redirected at lower prices to China. That hurts Gazprom immensely and indirectly, as you will see in a moment, also puts pressure on global LNG prices, which hurts Novatek. So much for 3D chess. Russian roulette is closer to the mark.
The Big Chinese Switch
The larger story for LNG is China.
Energy security has been a strategic priority since Xi Jinping took office. In 2014–2015, Xi championed an “energy production revolution,” explicitly pushing domestic oil and gas output to reduce geopolitical dependency.
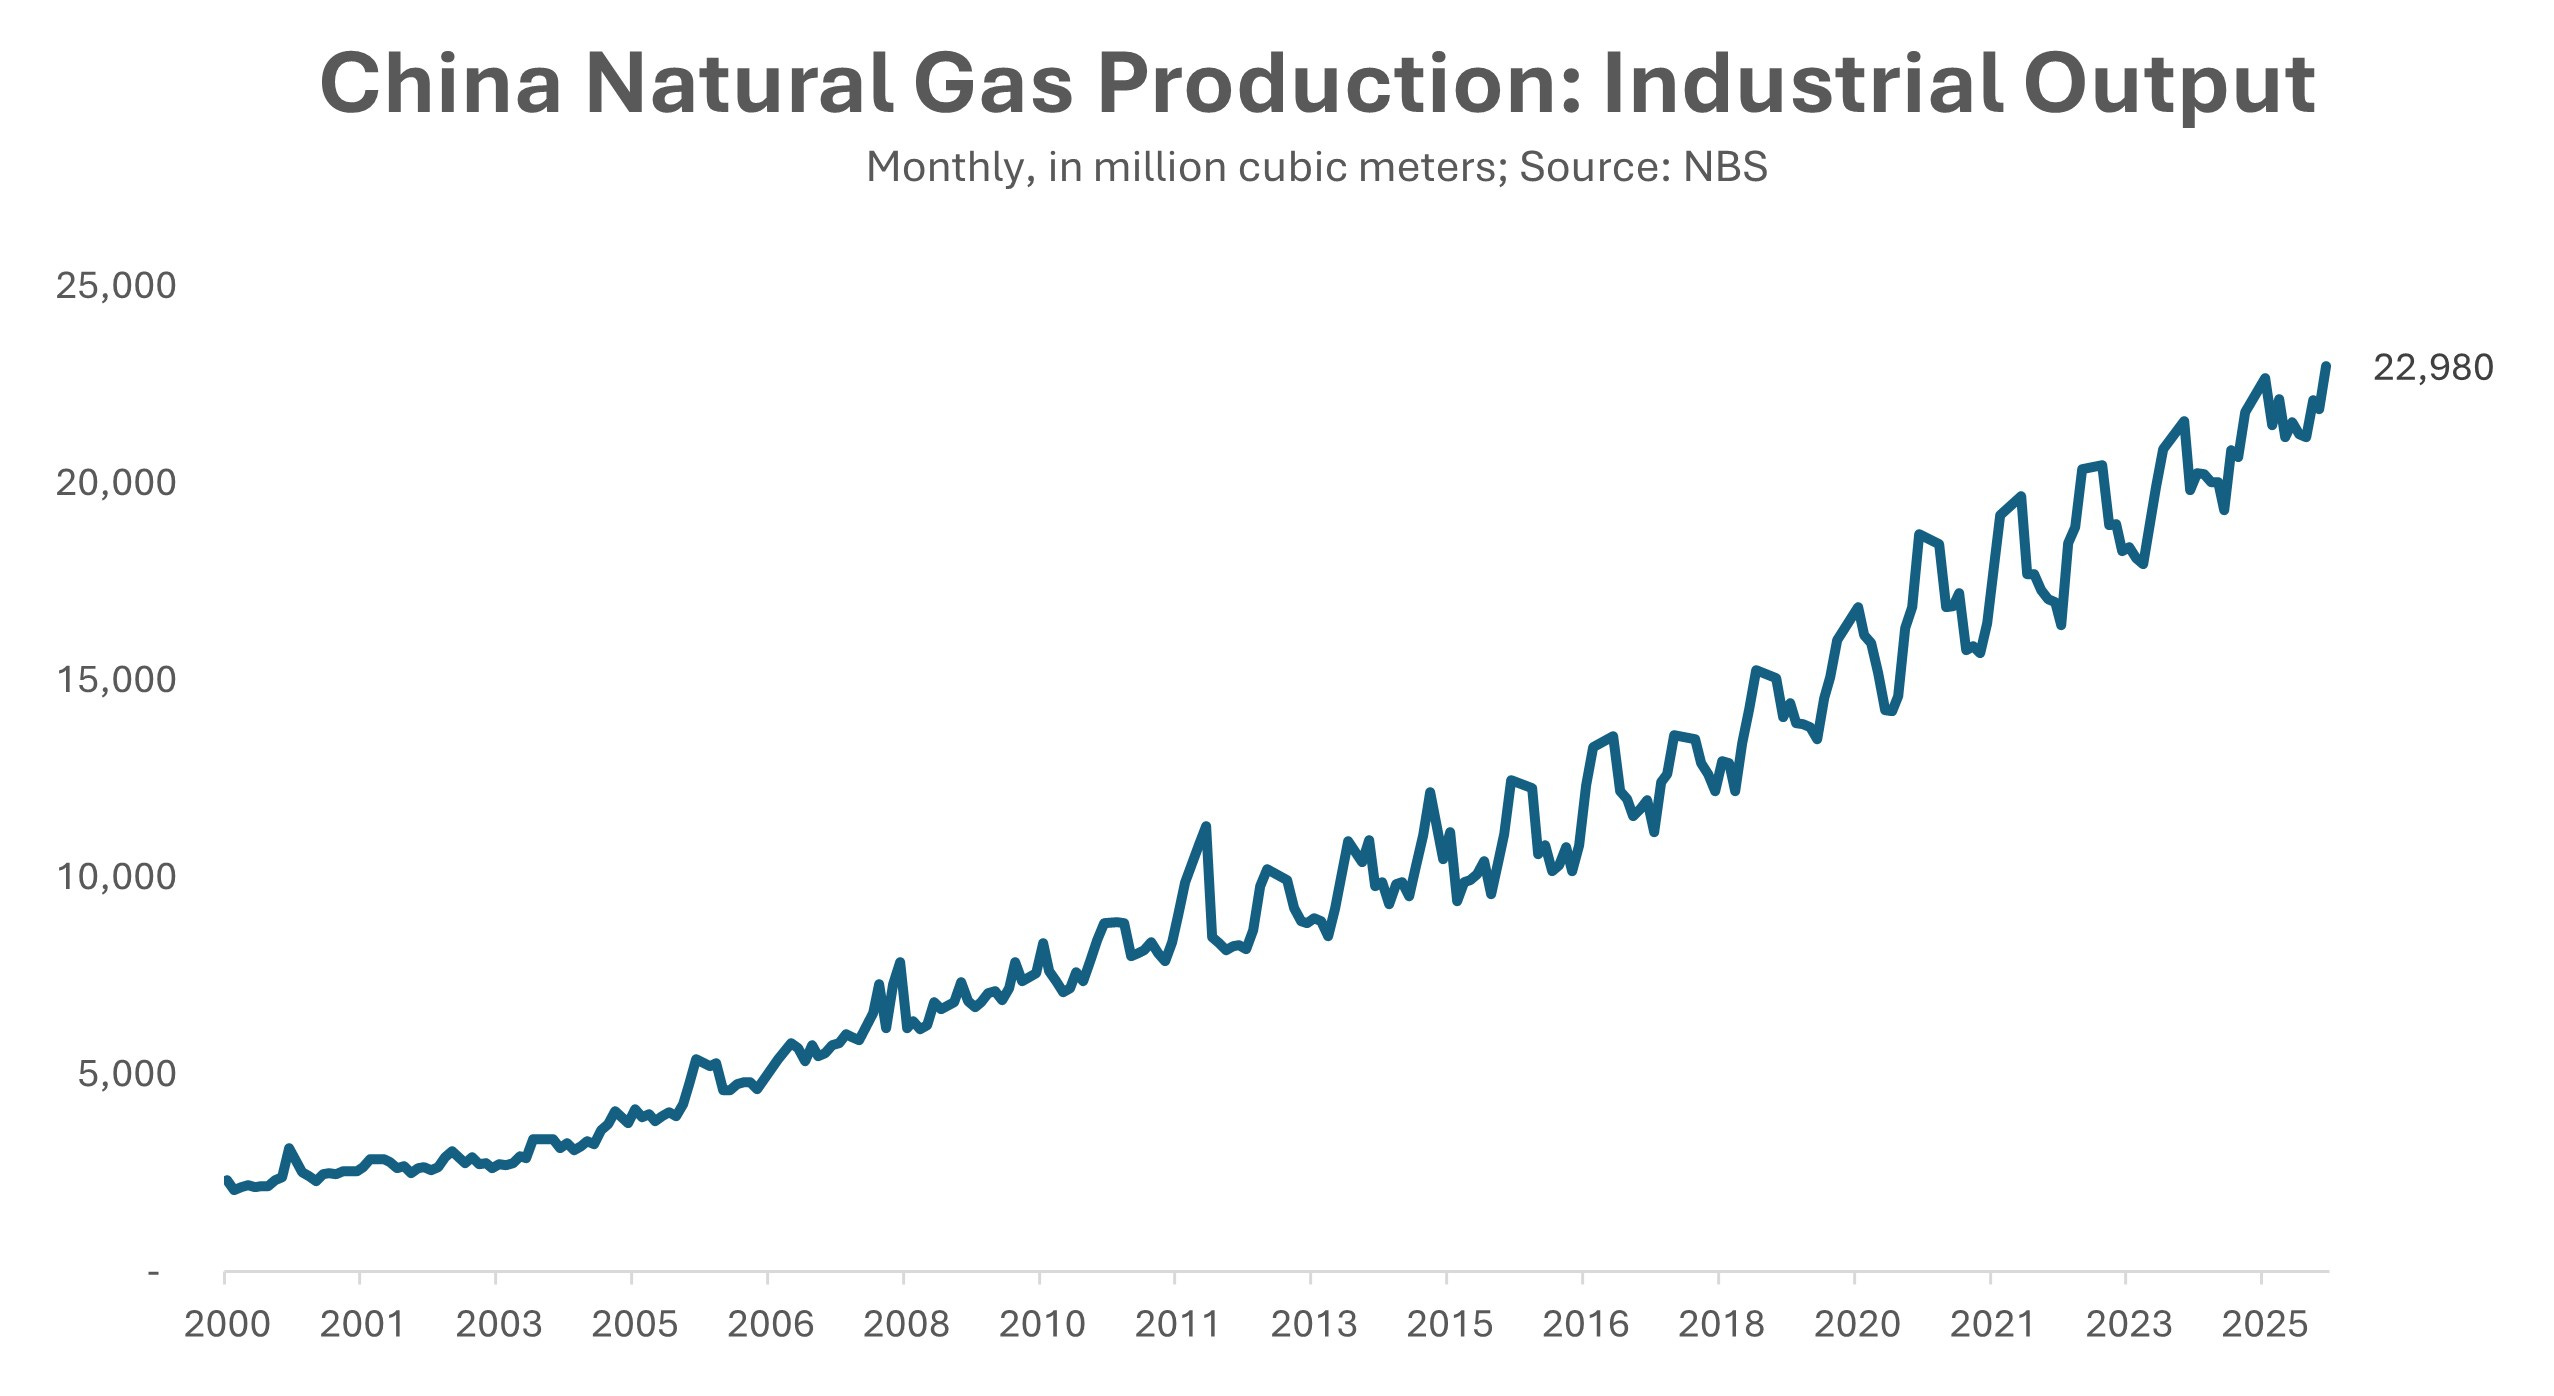
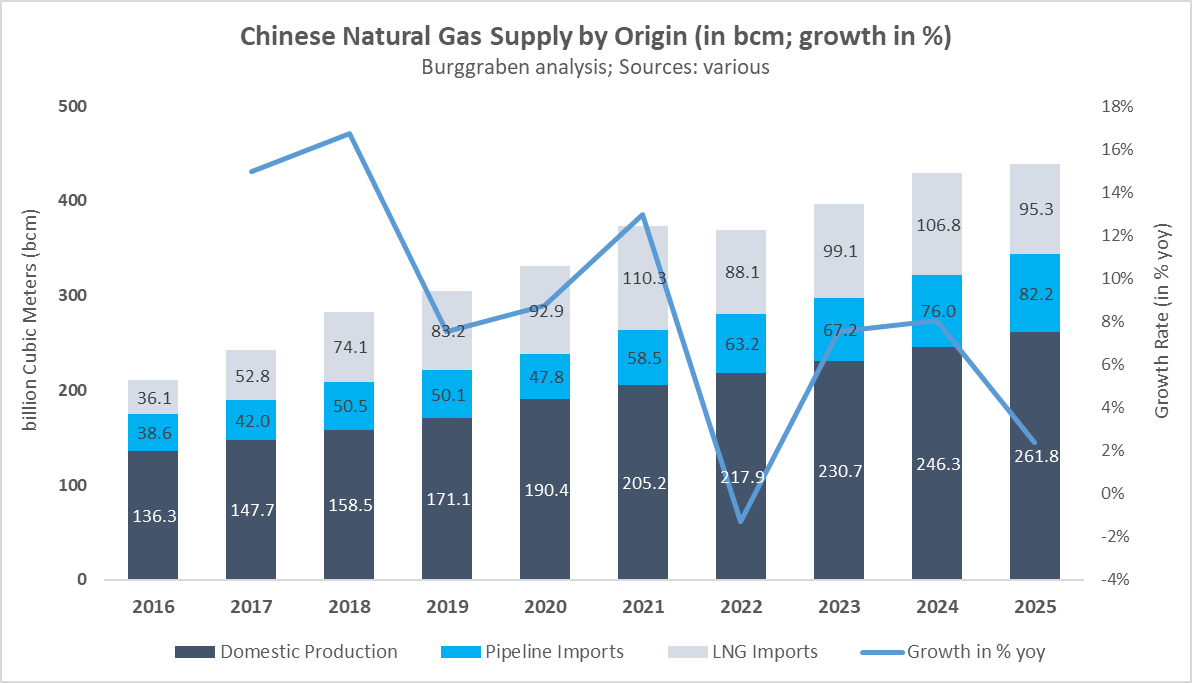
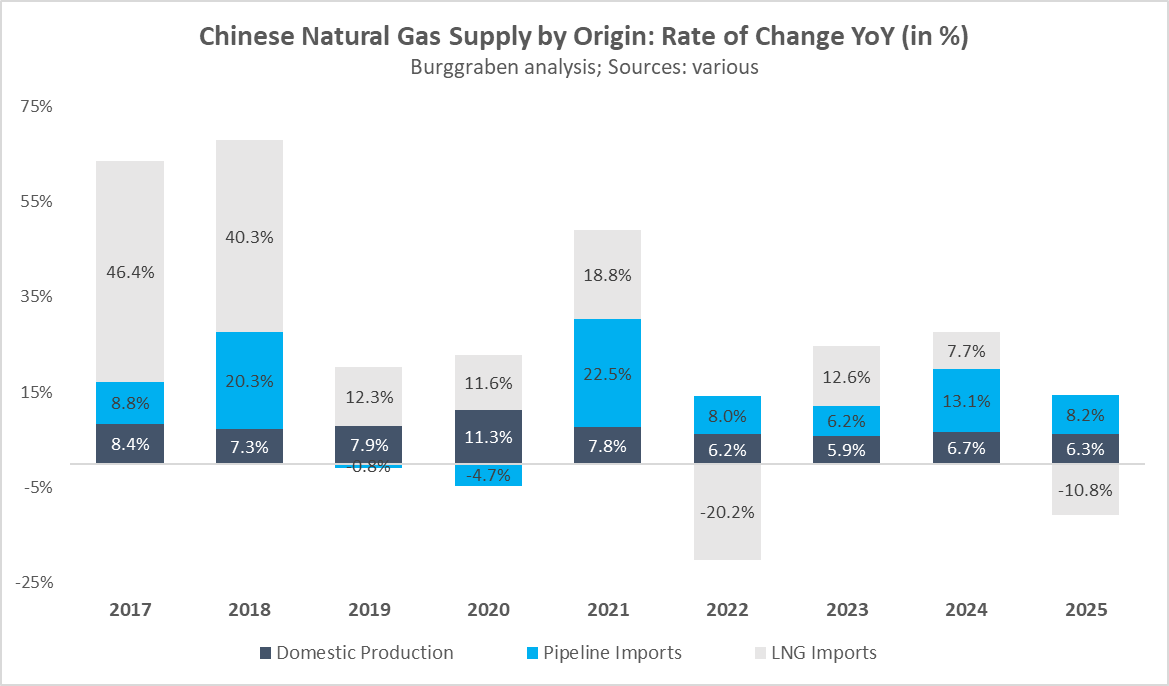
The results are measurable. According to official data we collect locally, Chinese domestic gas production reached 261bcm in 2025, up from 136bcm in 2016. Output has doubled in less than a decade. That is structural.
Pipeline imports are the next lever — and they are cheaper than LNG.
In 2025, China imported pipeline gas from Russia, Turkmenistan and Myanmar, with technical capacity around 120bcm and actual imports likely around 82.5bcm, pending December data.
That capacity will expand materially. Commercial agreements are now in place for up to 106bcm of imports from Gazprom alone.
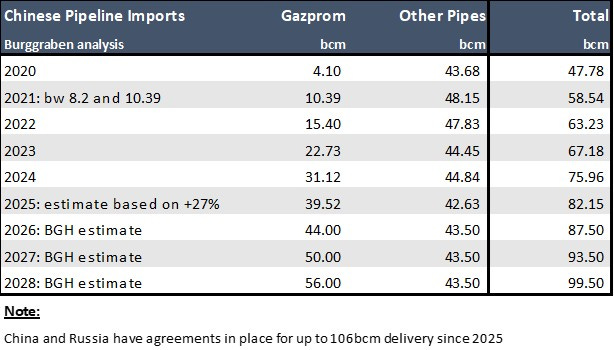
The Central Asia–China pipeline, anchored by Turkmenistan, carries 55bcm per annum of technical capacity. The Power of Siberia (PoS) pipeline from Russia has 61bcm of technical capacity. Myanmar contributes another 5.2bcm.
Until 2024, however, China had commercial agreements in place for only 38bcm of the 61bcm technical capacity from Gazprom’s Power of Siberia. In other words, physical pipe capacity exceeded contracted volumes. The infrastructure was ahead of the commercial reality.
That changed in 2025. China signed additional commercial agreements for what is now referred to as the Far Eastern Corridor, effectively an extension of Power of Siberia tapping the Sakhalin fields, adding another 12bcm of contracted capacity. More importantly, Beijing and Moscow appear to have agreed the commercial contours for Power of Siberia 2 (PoS2), a new 55bcm pipeline targeting a 2030 start.
If PoS2 proceeds as planned, commercially agreed Russian pipeline volumes alone rise to 106bcm per annum.
Now step back and look at the physical picture.
Add the 55bcm Central Asia corridor, 61bcm Power of Siberia, 12bcm Far Eastern Corridor and 55bcm Power of Siberia 2, plus the 5.2bcm Myanmar line, and China’s total technical pipeline import capacity could reach roughly 183bcm per annum post-2030.
Put that against apparent demand of 426bcm in 2025, which was essentially flat year-over-year. Even without heroic demand growth, pipeline gas alone could theoretically cover close to half of China’s total gas consumption within a few years. And pipeline gas, as we know, sits structurally lower in the cost stack than LNG which should alter the structural shape of the Asian LNG balance.
Either way, it is not difficult to see where this is heading.
China, recessionary as it is — and I encourage you to revisit my China series if there is any doubt — is unlikely to generate the sort of explosive apparent demand growth that underpinned LNG optimism over the past decade. Demand may grow slowly in the coming years. It may not grow at all.
Meanwhile, domestic production continues to rise at a remarkable pace and pipeline imports are expanding structurally, in many cases at double-digit rates. Both sources sit lower in the cost stack than LNG and will therefore push the more expensive molecule out of the merit order whenever possible.
Over time, that mechanism leaves LNG as the balancing supply rather than the growth driver in the Chinese market.
LNG Surplus
Finally, to the decisive factor: the wave of new LNG export capacity that is about to hit global markets.
Capacity timelines always move. The latest example comes from Qatar, where state-owned QatarEnergy has pushed the start of part of its multibillion-dollar LNG expansion towards the end of the year. That is not unusual. Mega-projects shift. But the direction is unmistakable. Qatar plans to expand from roughly 83 million tonnes today to around 145 million tonnes by 2035. That is not incremental. That is structural.
The real acceleration, however, is coming from North America. Between 2024 and 2029 alone, the region is on track to add roughly 120–140bcm per annum of new LNG export capacity. Put differently, North America is set to more than double its LNG export footprint within five years.
For perspective, 140bcm is roughly what all of Europe, as defined by our perimeter, imported in 2022 and again in 2023. Imports fell to 114bcm in 2024 before rebounding to 146bcm in 2025. In other words, North America alone is adding the equivalent of an entire European LNG consumption market within half a decade.
Unlike Qatar, much of this US supply comes with destination flexibility. That matters. Cargoes can move to whoever pays the highest netback, irrespective of geography. Portfolio players can arbitrage between Europe and Asia without contractual constraints. Qatar, by contrast, requires its counterparty to lift the cargo, limiting re-routing flexibility. It is one reason Japanese utilities have been reluctant to extend long-term Qatari contracts post-2021.
Cheniere, by far America’s largest LNG exporter with an enterprise value around US$75bn, estimated during its Q3 2025 earnings call that global LNG export capacity will increase by roughly 180 million tonnes — around 252bcm — between now and 2030, with additions peaking in 2028. Consultant forecasts embedded in that presentation show spot LNG prices around US$6/MMBtu by 2028. At those levels, liquefaction margins will compress materially, even for the lowest-cost operators.
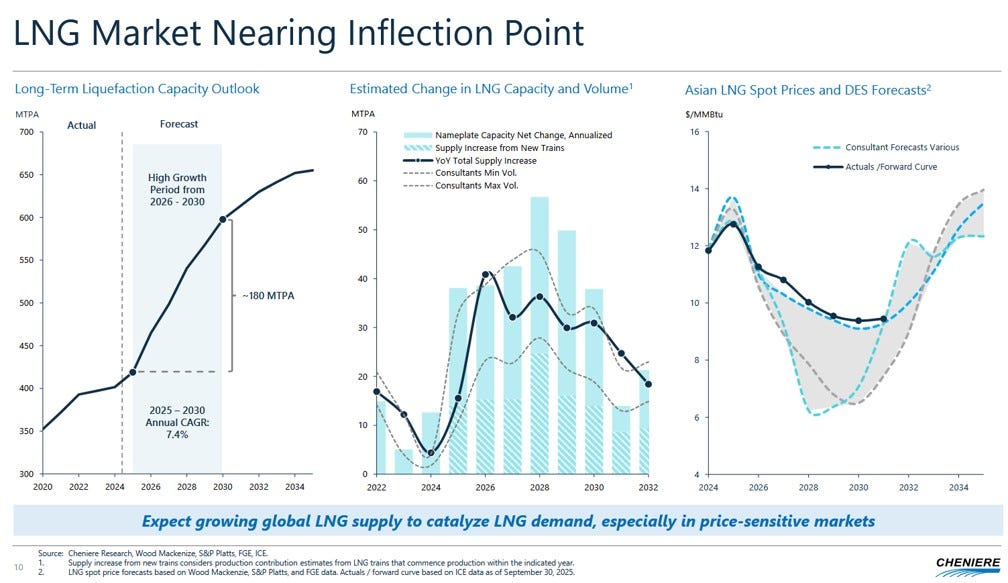
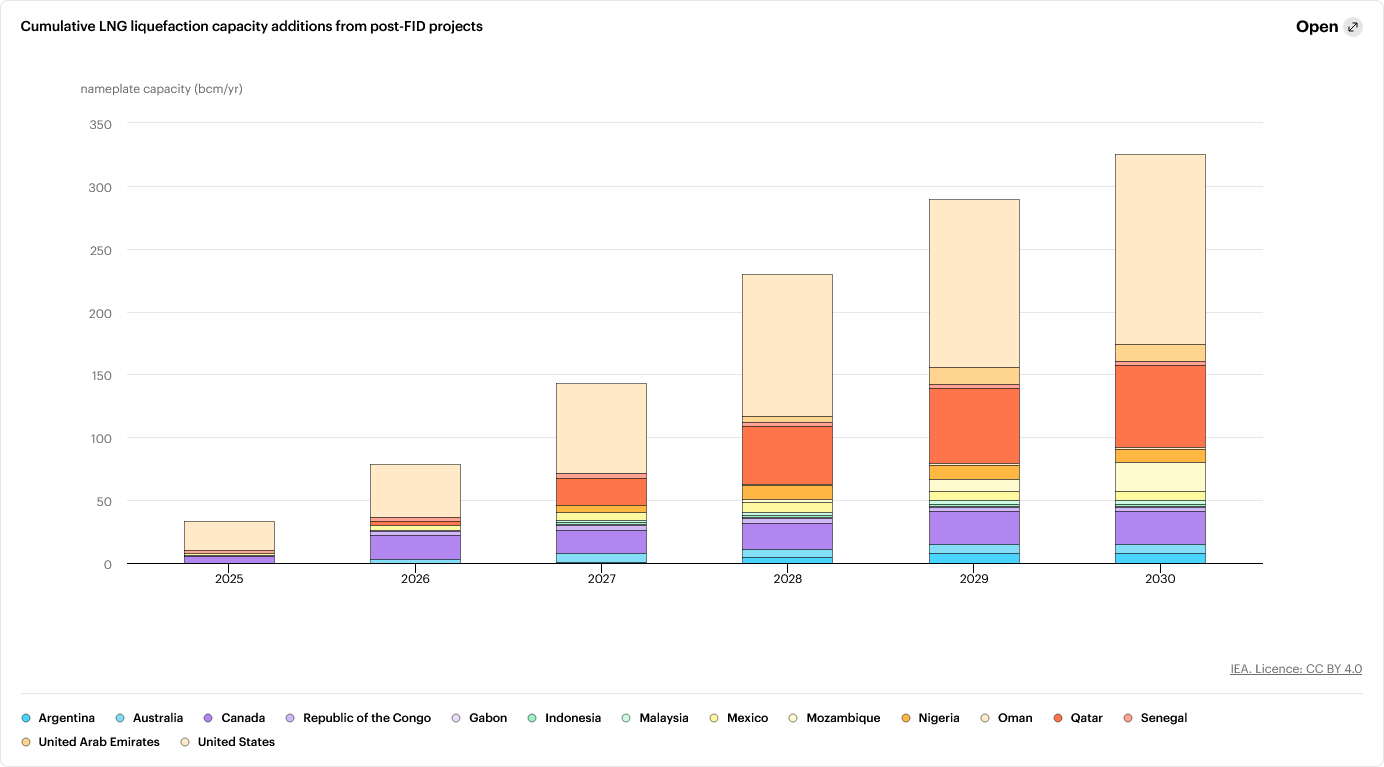
The IEA, not an agency I treat as gospel, nevertheless estimates roughly 325bcm of new LNG export capacity between 2025 and 2030. That implies a 50% increase on today’s global capacity base of around 620bcm.
Pause on that number.
A 50% expansion in capacity within five years is not a marginal adjustment. It is the largest build-out in LNG history, based on projects that have already reached FID and are under construction. This is what commodity boom-bust capex cycles look like when high prices attract capital at scale. Textbook right here, or rather MBA book.
Who absorbs that volume? At current demand trajectories in Japan and China, certainly not Asia at the same pace as before. Europe can take part of it, but not all of it, especially in a structurally softer demand environment.
Commodities price at the margin. A surplus of even 5% is enough to tilt the market decisively. LNG is no different.
Between 2021 and 2023, LNG generated extraordinary profits, particularly for portfolio players such as Shell and Trafigura. Capital followed those returns, as it always does. Now the supply arrives. And once it does, it tends to stay.
Yes, projects can slip. Construction delays happen. New FIDs may be postponed. Some approved projects may never proceed. But the direction of travel is clear. These are multi-year infrastructure commitments underwritten by majors and long-term LNG players. They are not easily reversed.
The curve reflects this reality already. TTF trades around US$11/MMBtu today and slopes toward roughly US$7/MMBtu by mid-2030.
That is the good news for Europe’s medium-term gas balance. Now let me turn to what complicates that otherwise beautiful story.
Structural Vulnerability
We are now firmly in what I call the Post-Gazprom regime of European natural gas.
That regime forced European customers and utilities to adapt to the loss of roughly 140bcm of Russian pipeline supply. On a pre-crisis market of 450–460bcm, that represents a 30% supply shock. Few energy systems absorb such a shock in peacetime without structural consequences.
Europe rebalanced those 140–145bcm losses within roughly two years. LNG imports increased by around 50bcm relative to 2019, while consumption fell by roughly 80bcm versus the same reference year. The market adjusted. The numbers prove it.
But the defining structural change since 2017 is neither lower demand nor higher LNG imports. It is the collapse in non-storage coverage.
Let me explain.
Before the Gazprom rupture, Europe entered winter with a system that largely balanced itself in real time. Pipeline imports and domestic production together covered a substantial share of winter consumption. Storage and LNG played important roles, but they acted primarily as smoothing mechanisms.
That world no longer exists. The chart below shows what I call the Non-Storage Coverage Ratio, defined simply as pipeline imports plus domestic production divided by consumption. In the pre-2019 period, this ratio oscillated between roughly 0.6 and 1.0 during winter months.
Winter 2016/17 illustrates this clearly (red square on the left).
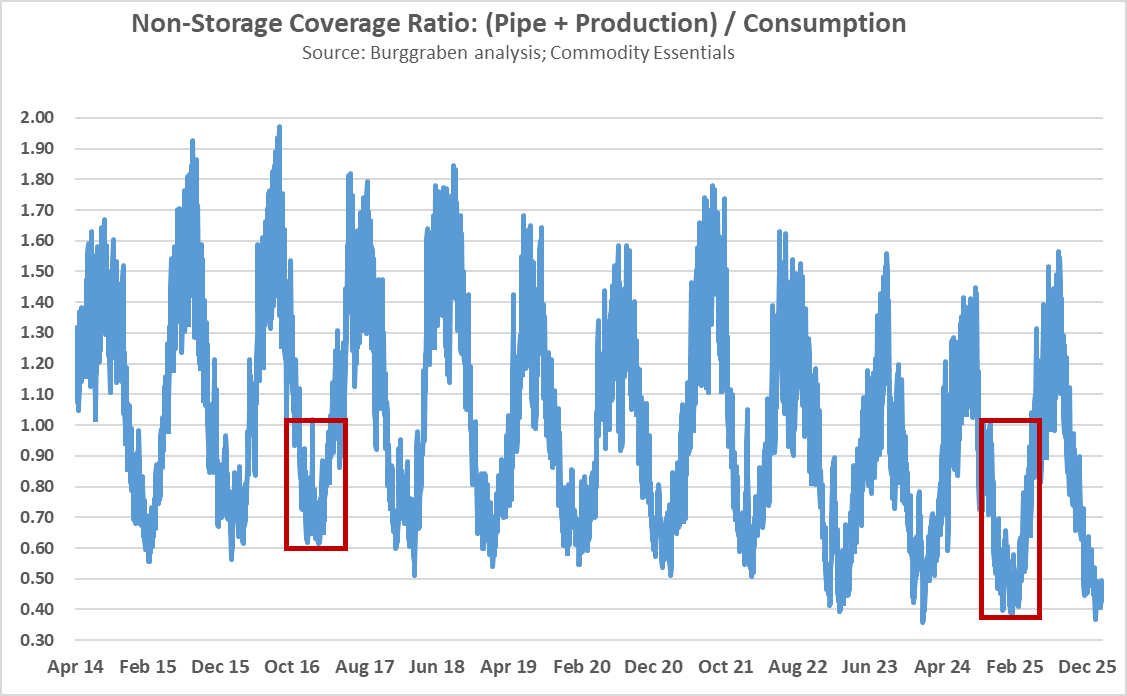
In plain English, Europe could largely meet winter demand by adjusting between modest incremental LNG imports and storage withdrawals. Utilities had optionality. They could optimise based on price and availability.
Storage was used heavily — as designed — but it functioned as insurance rather than survival. Pipeline gas and domestic production provided ample daily flow during peak winter consumption and, crucially, excess capacity in summer to refill storage comfortably. In summer 2016, the Non-Storage Coverage Ratio peaked at 1.97 on 7 August. That was a system with headroom.
Post-Gazprom, the ratio has shifted structurally lower.
Winter coverage now frequently falls toward 0.35 and no longer approaches 1.0 between December and February, when Europe is coldest. In practical terms, that means half or more of winter consumption must now be met by a combination of storage withdrawals and LNG imports.
Both must function. If either fails, the system tightens abruptly by February or March. That is what I mean by a straightjacket.
Visually, compare the right-hand winter square during 2024/25 with the left-hand square from 2016/17. The difference is not marginal. Even during summer months, the ratio now struggles to exceed 1.5. That is the new operating regime.
This shift is mechanical, not cyclical. It reflects the loss of roughly 140bcm of Russian pipeline gas combined with steadily declining domestic production in the Netherlands and the UK. Nothing has replaced that continuous flow-through supply. Nor do many policymakers appear to appreciate how materially that matters for industrial security in Europe.
LNG Is Not (Yet) a Full Substitute for Pipeline Gas
This distinction is often glossed over.
Pipeline gas and LNG are not interchangeable inputs within the European system. Pipeline gas is continuous, predictable and largely insulated from short-term global price swings. Its infrastructure was purpose-built over decades to match Europe’s consumption patterns and industrial geography.
LNG, by contrast, is episodic, price-clearing and globally contested. Its infrastructure — particularly in North-West Europe, Poland and the Baltic States — remains largely improvised, built at crisis speed rather than as part of a long-term design. That difference matters.
It is precisely for that reason that I exclude LNG from the non-storage coverage metric.
The second chart makes the point clearly. Europe’s LNG sensitivity — defined as LNG imports divided by consumption — has surged since 2021. What was once a marginal balancing component has become a dominant swing factor, frequently exceeding 70% during summer months.
Europe now depends on LNG not merely as a supplement, but as the primary mechanism to refill its storage.
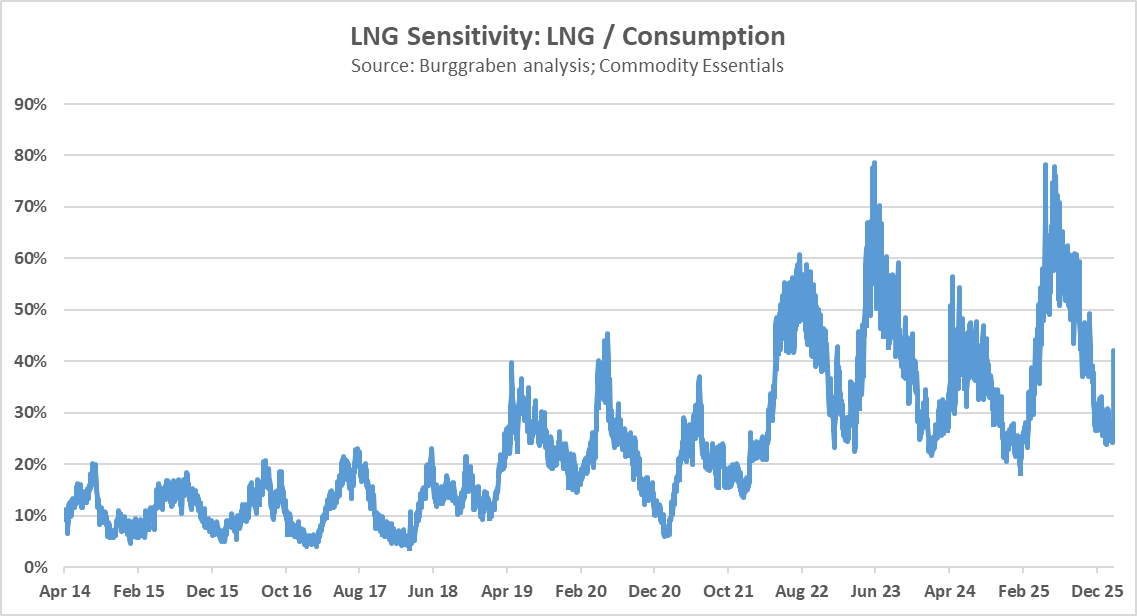
Pre-2019, winter reliance on LNG was minimal. During winter 2017, LNG sensitivity was as low as 4%. In other words, only 4% of winter consumption depended on LNG. That is negligible.
Moreover, much of that LNG flowed into Iberia due to geographic isolation and limited pipeline interconnection with the rest of Europe. Spanish and Portuguese households certainly require gas, but their winter heating needs are structurally lower than in North-West and Central Europe. A cold winter in Poland or Lithuania is not remotely comparable.
Europe now operates under a dual winter dependency:
structurally higher reliance on storage withdrawals, and
structurally higher exposure to global LNG availability and pricing.
Storage is no longer merely a buffer. It has become the load-bearing pillar of the system.
The Post-Gazprom Reality
This is the core vulnerability of Europe’s gas market in the post-Gazprom era.
Mild winters are manageable. Recent seasons have shown that. But the margin for error has narrowed significantly compared with a decade ago. Cold weather does not need to be extreme to matter. It merely needs to coincide with tighter LNG balances elsewhere.
Europe effectively traded pipeline security for LNG optionality and storage dependence after the Kremlin chose to weaponise gas flows. That trade works in a world of LNG oversupply and subdued Asian demand — the environment we are entering. It becomes fragile the moment either assumption is challenged.
Do not mistake this assessment for nostalgia for Russian gas. I have none. Allowing Nordstream 1 and 2 under Merkel created the illusion that nuclear capacity could be replaced with permanently cheap Russian gas-fired generation. That illusion collapsed.
If there was ever a role for the European Commission within market liberalisation, it was to enforce maximum supply concentration thresholds and preserve diversification. Supply diversity creates resilience. That principle was embedded in the early 2000s liberalisation framework but was never meaningfully enforced.
Perhaps a more disciplined approach would have altered Europe’s geopolitical trajectory. Perhaps not. Water under the bridge.
Curtailed - Not Reduced - Consumption
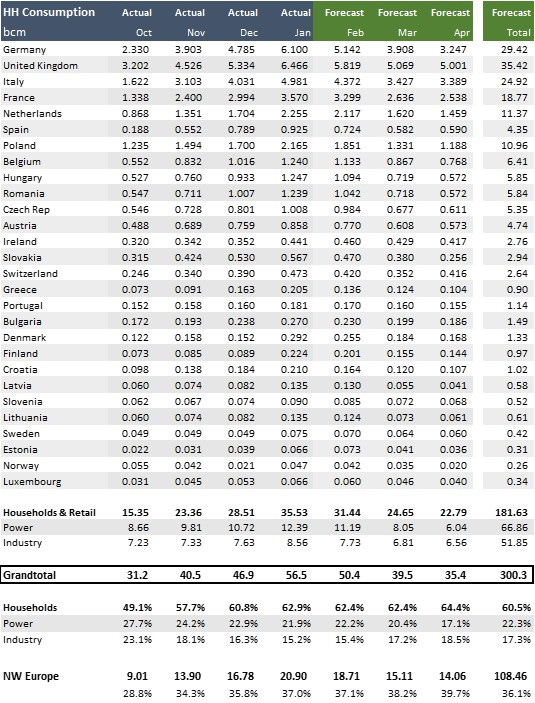
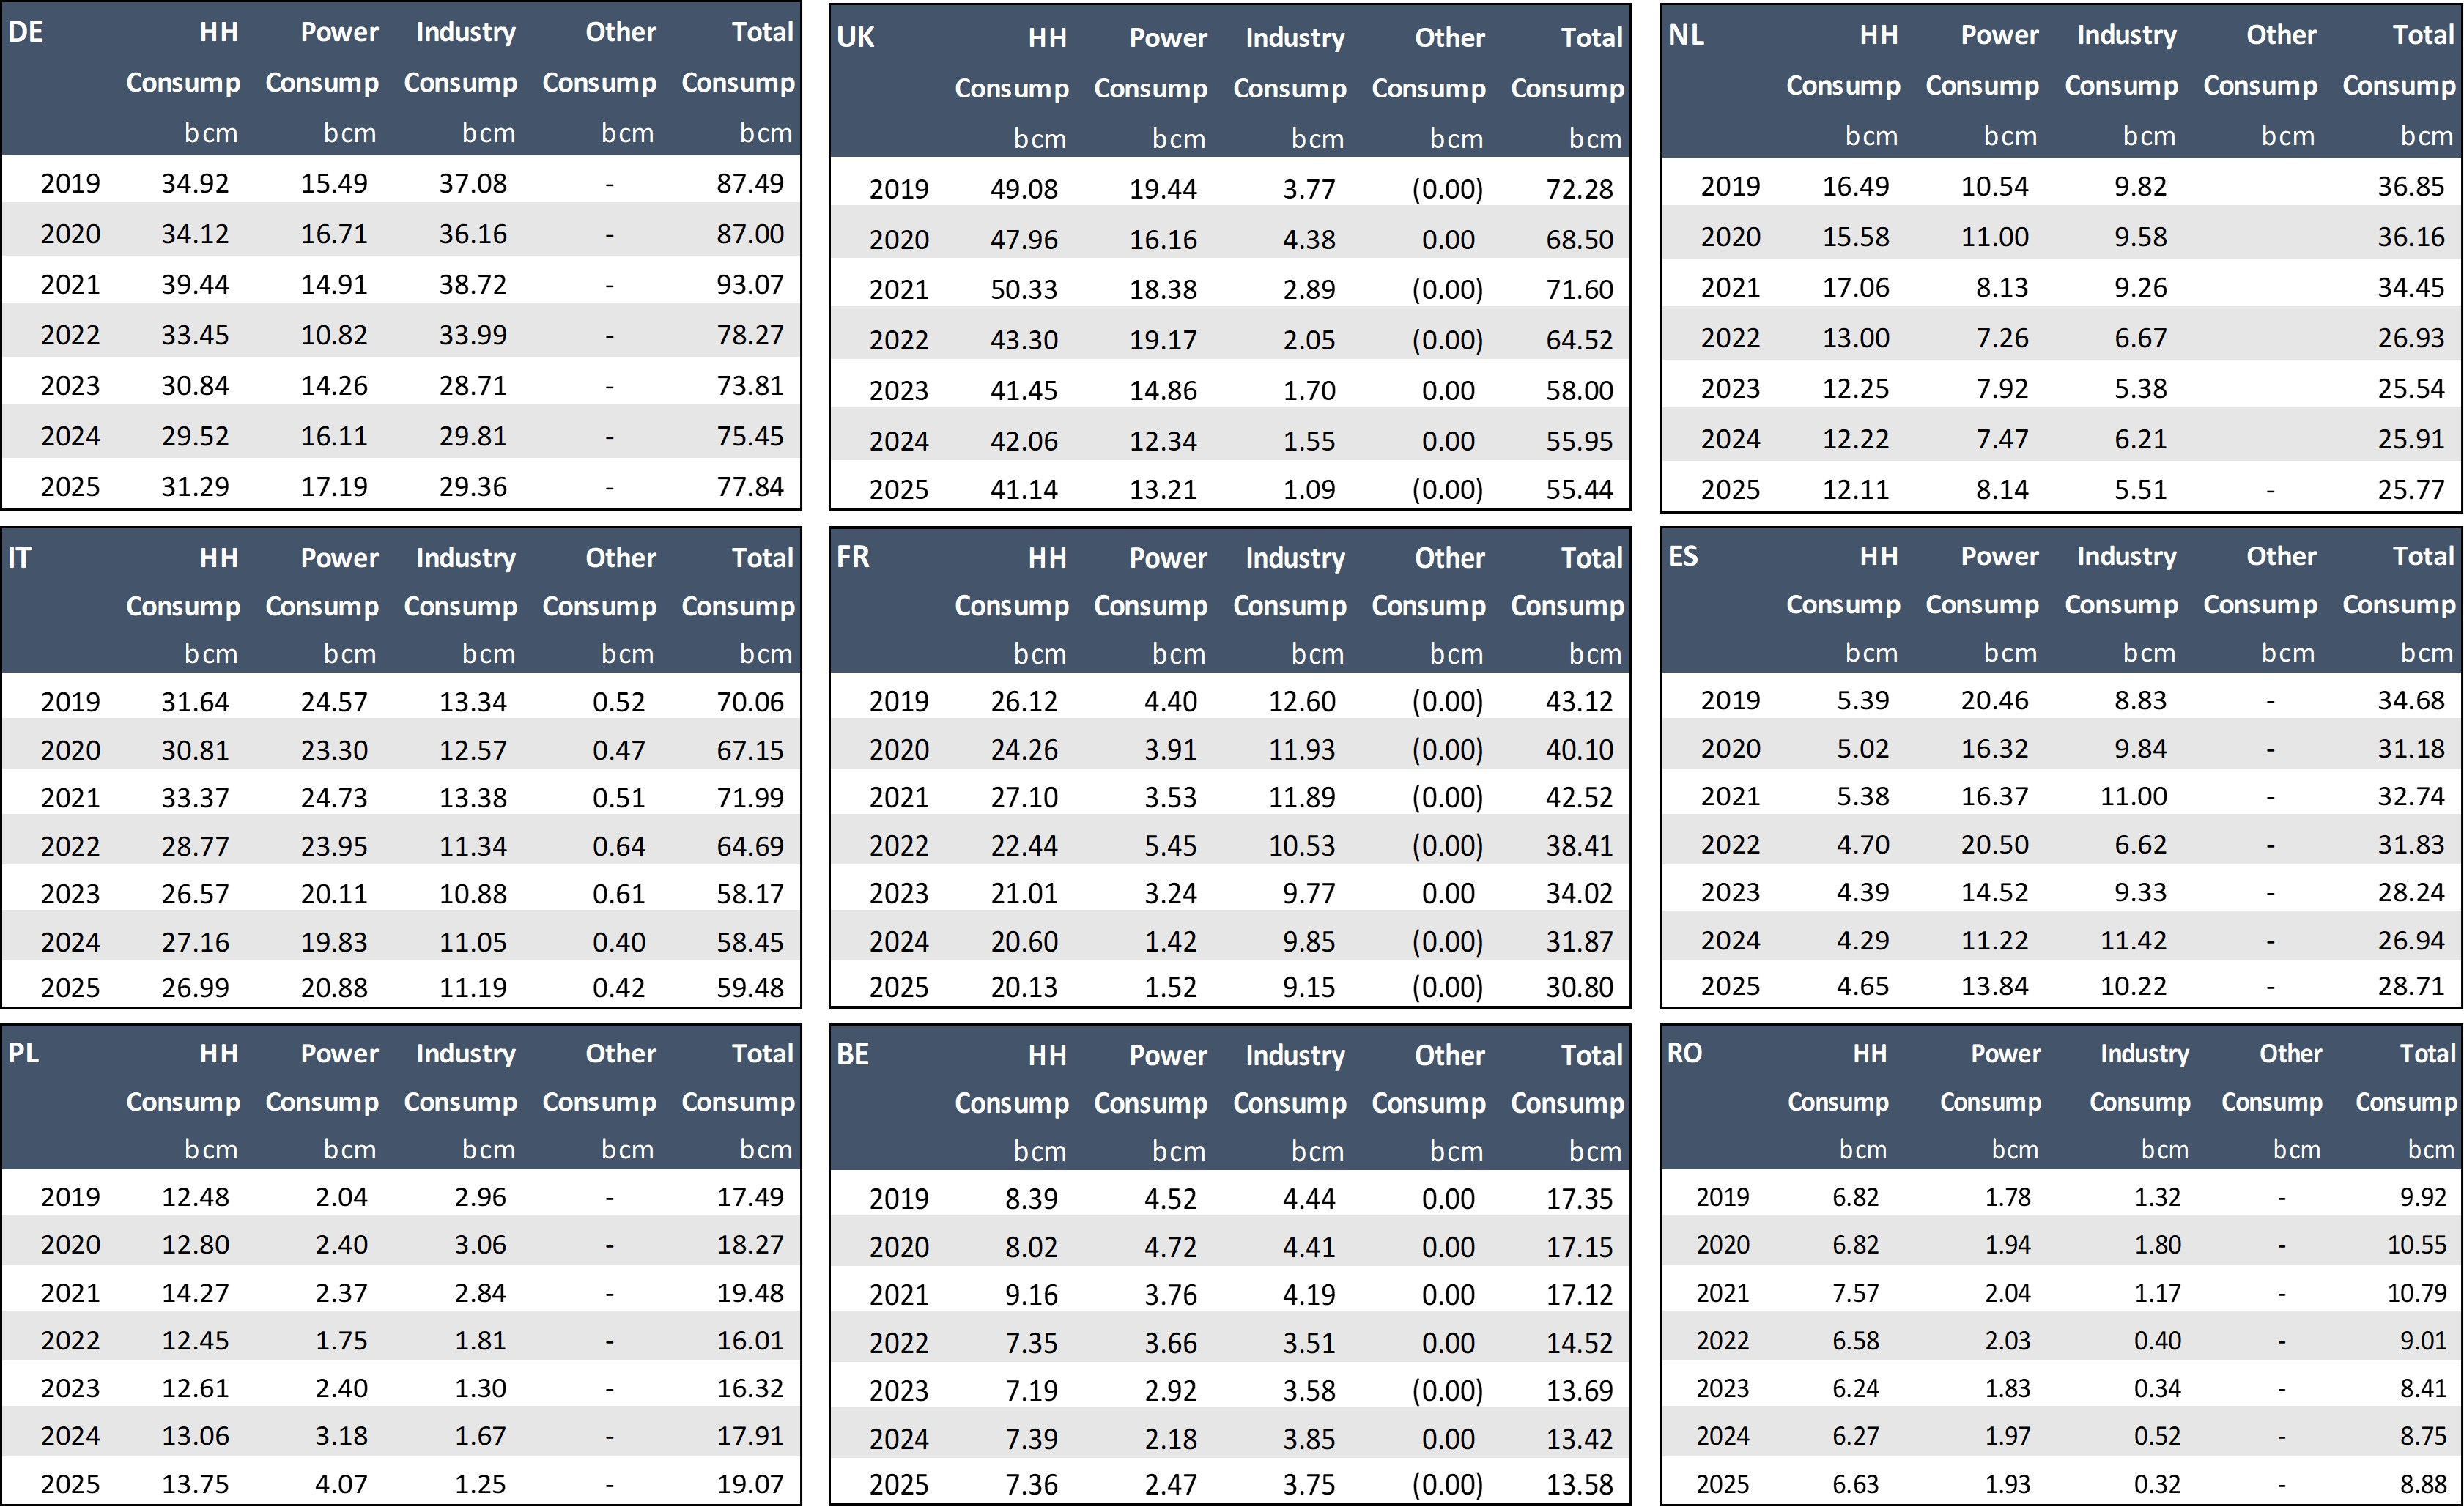
Natural gas in Europe is primarily used for heating — both households and industrial sites — and for power generation. It is therefore highly seasonal.
During winter months, more than 60% of total consumption derives from households. In summer, that share collapses toward zero. More importantly, peak winter consumption can exceed real-time supply by up to 100%, which is precisely why storage exists. Europe must withdraw gas in winter to balance the system.
A smaller but still important share of gas is used as industrial feedstock, for example in ammonia fertiliser production via the Haber–Bosch process. That component can be measured with reasonable precision, although reporting across all 28 countries is not entirely consistent.
Have Households Reduced Consumption post Gazprom?
This brings us to the first behavioural question.
Have European households permanently reduced gas consumption following the loss of Russian supply, as frequently claimed by policymakers? Have green policies in North-West Europe structurally altered private heating behaviour?
The short answer is: not meaningfully.
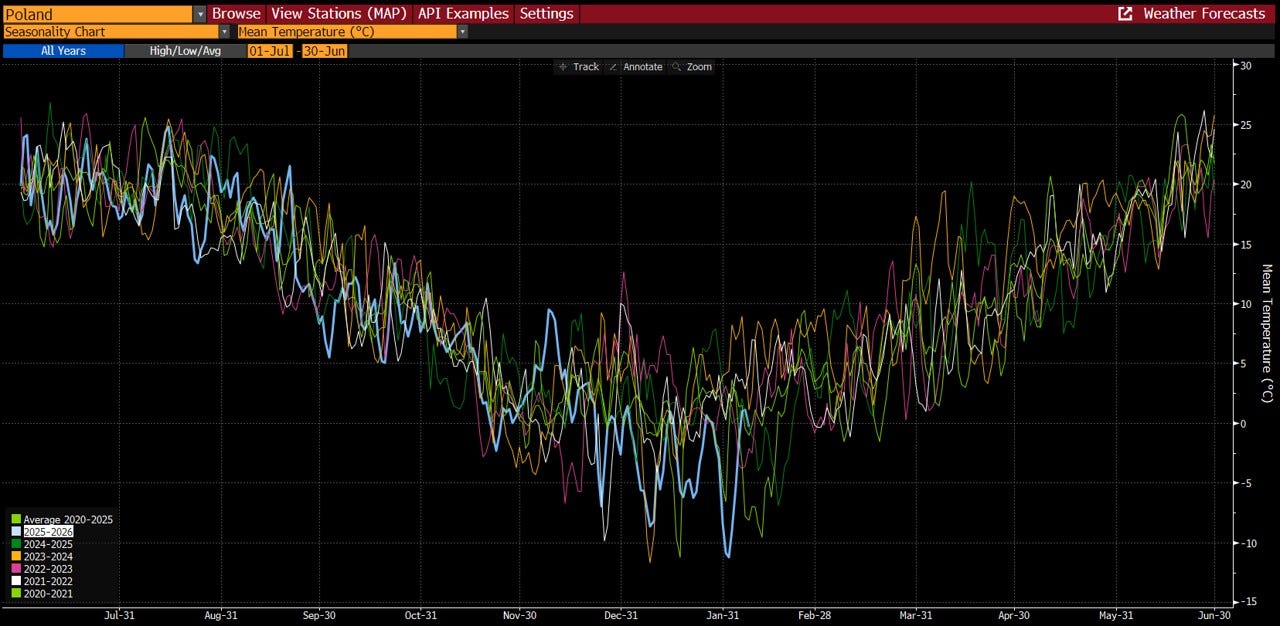
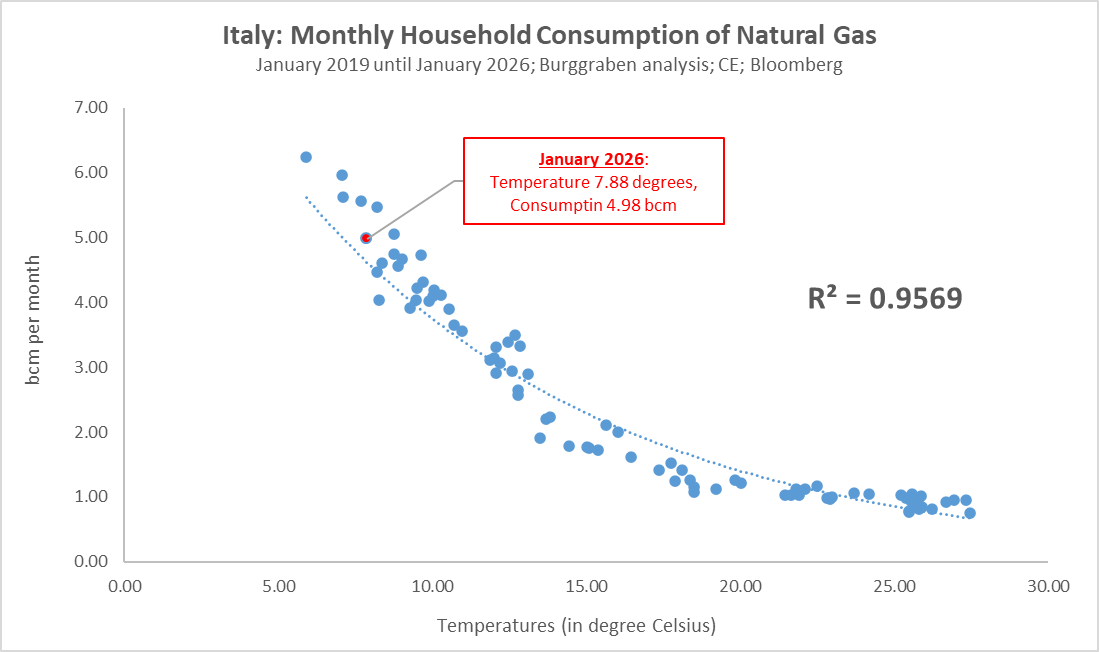
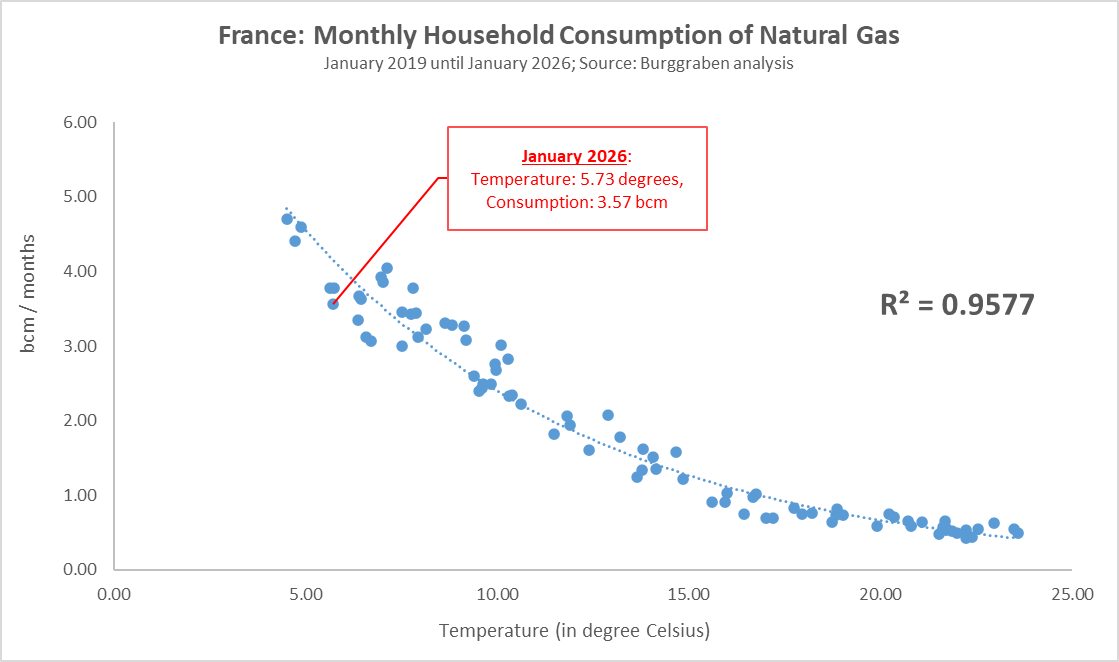
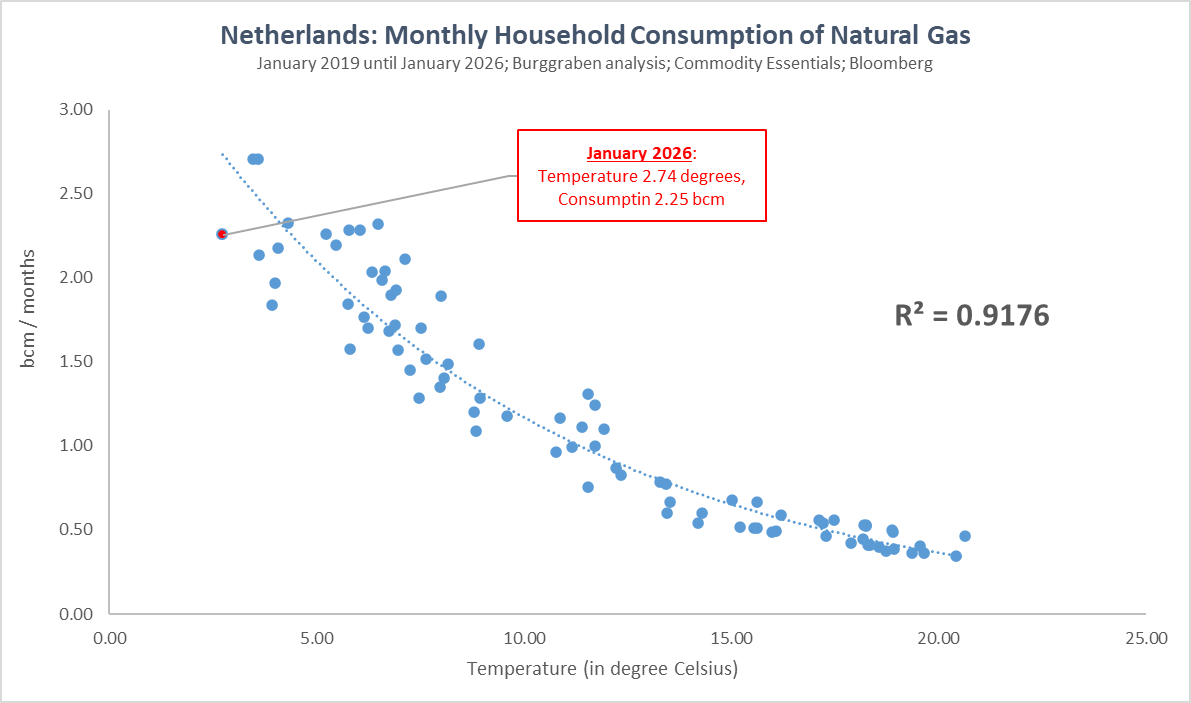
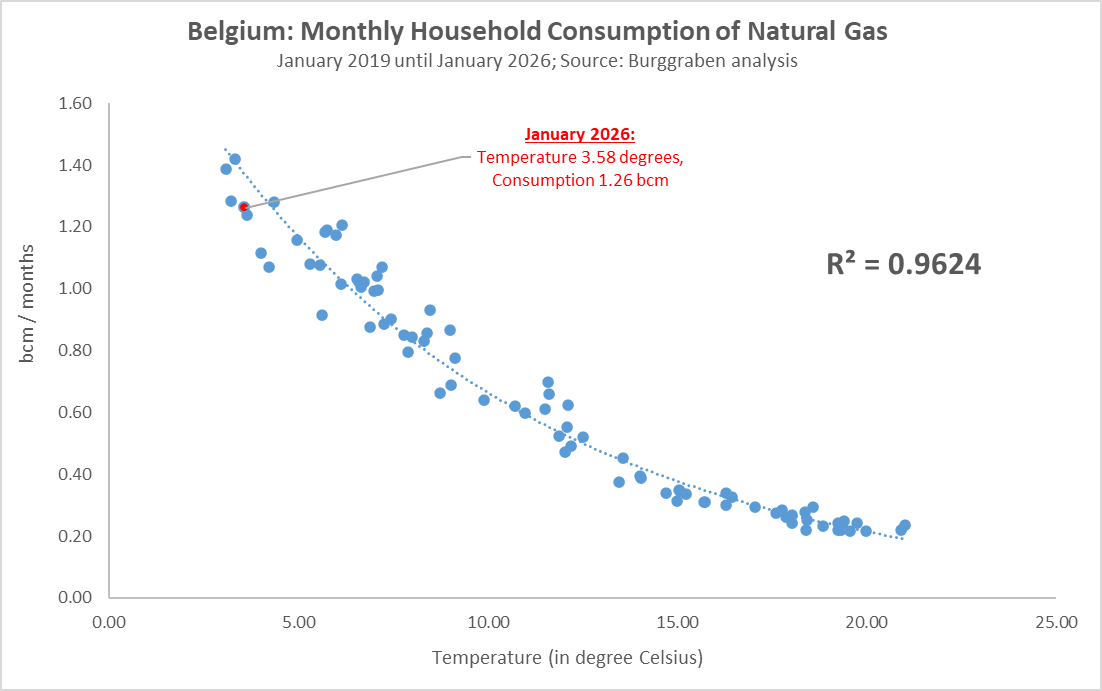
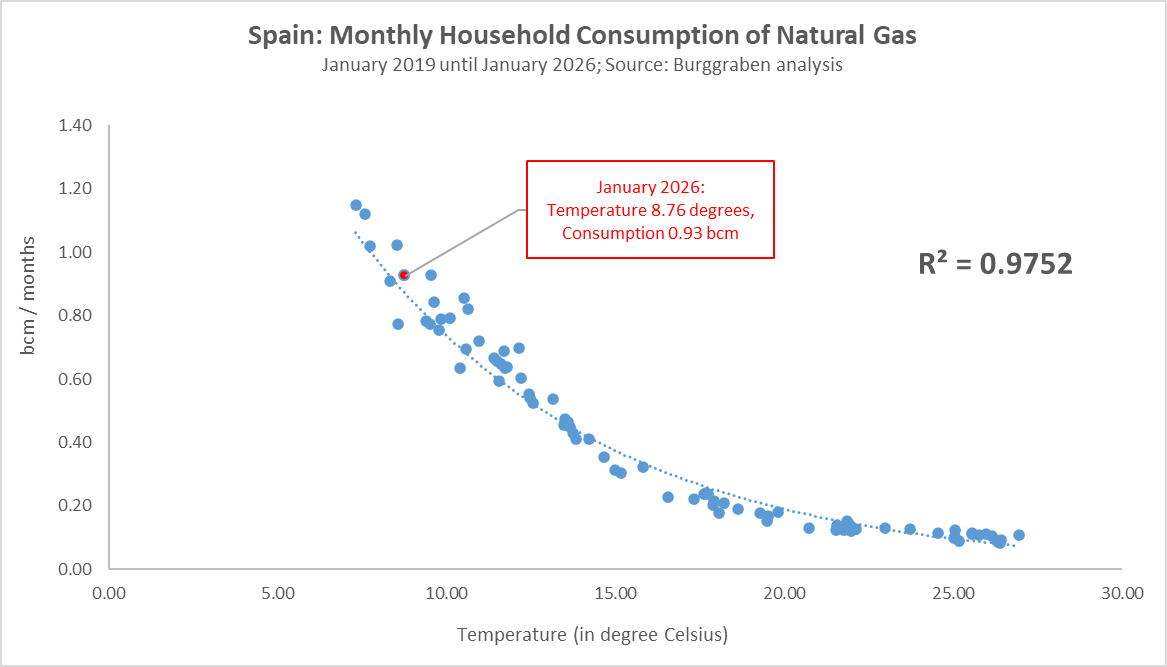
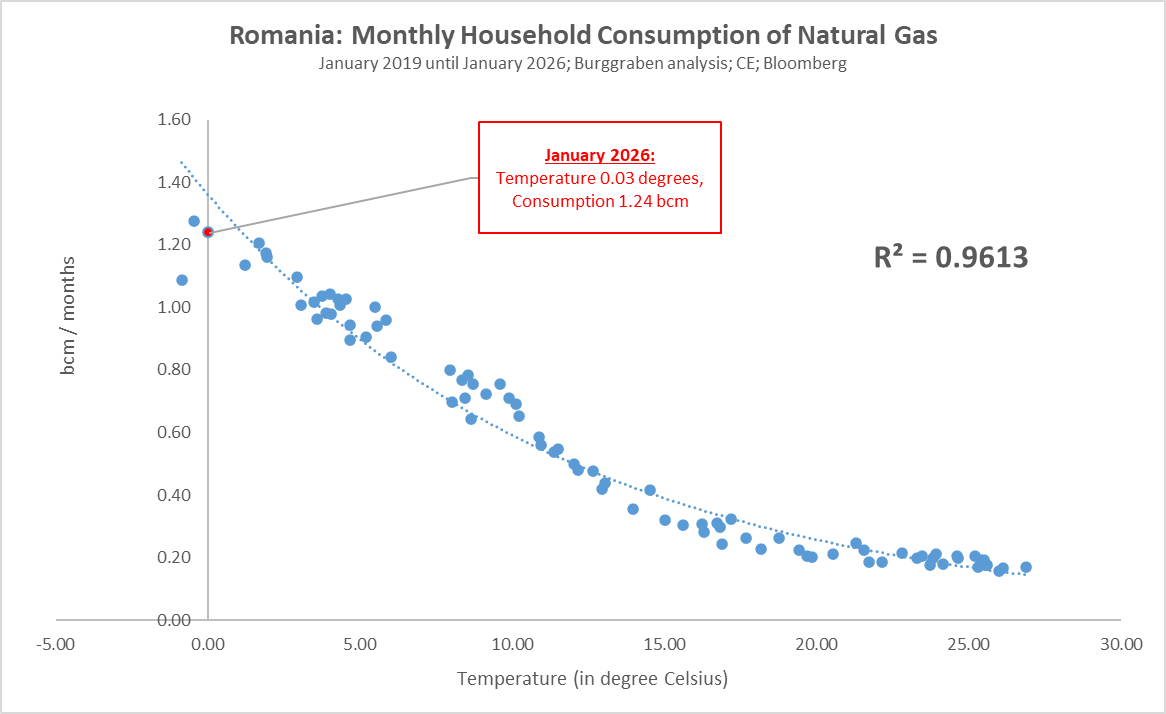
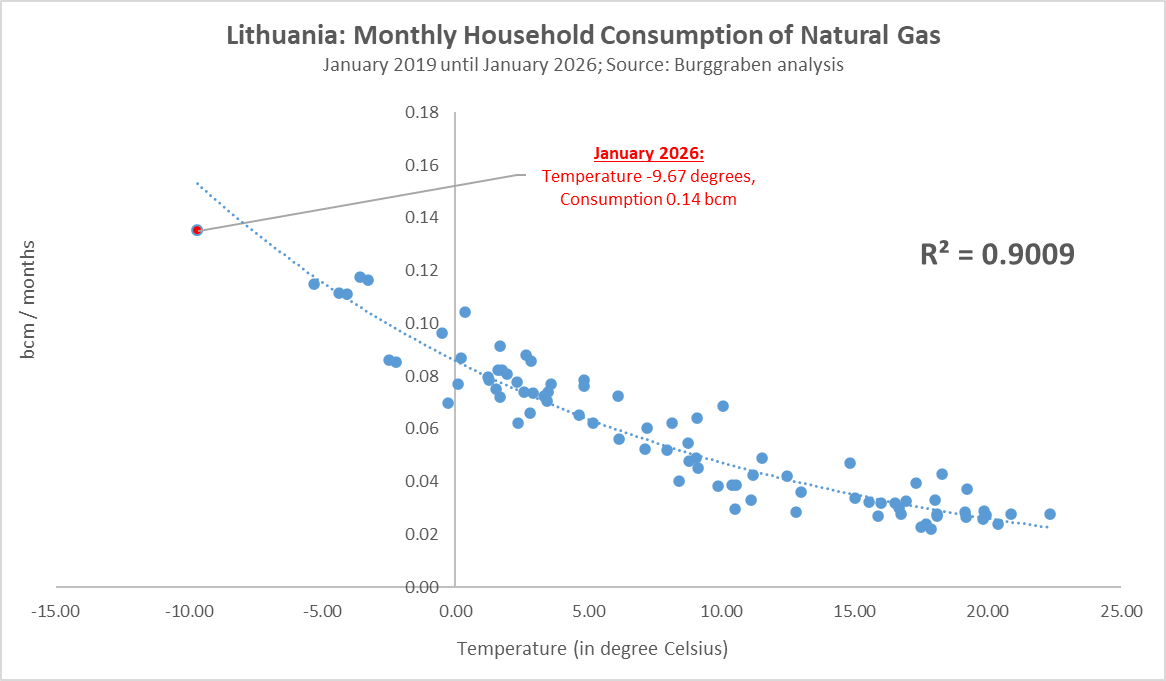
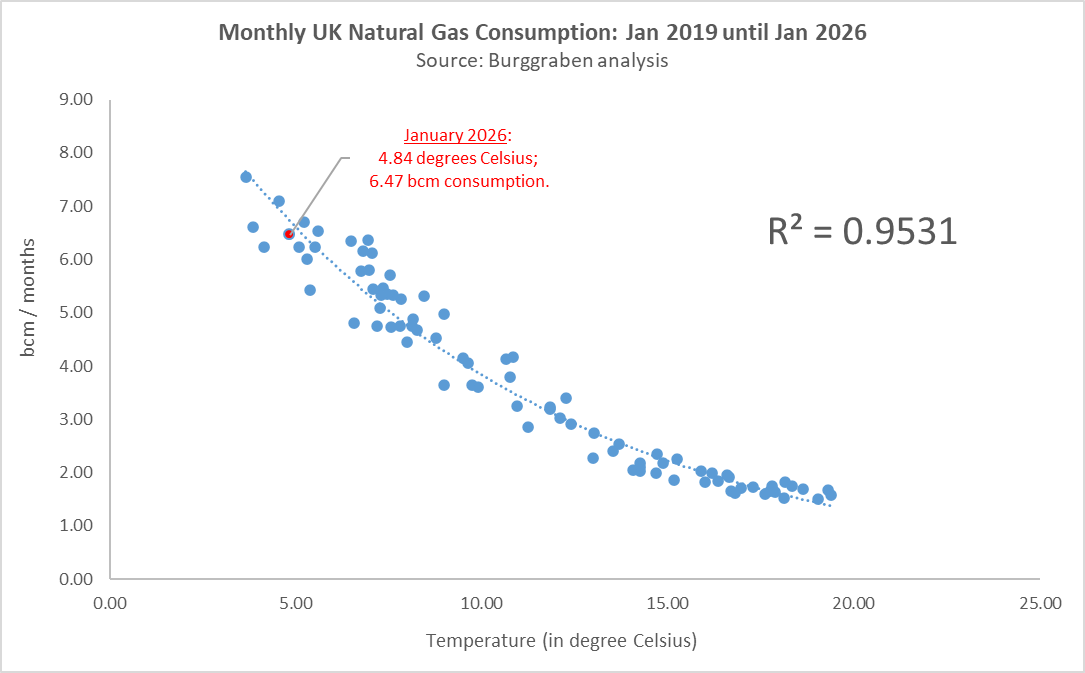
Household gas consumption is overwhelmingly driven by temperature. When temperatures fall, consumption rises — and it rises non-linearly. That relationship remains robust across virtually all European countries, with the partial exception of Scandinavia, where electricity plays a larger role in heating.
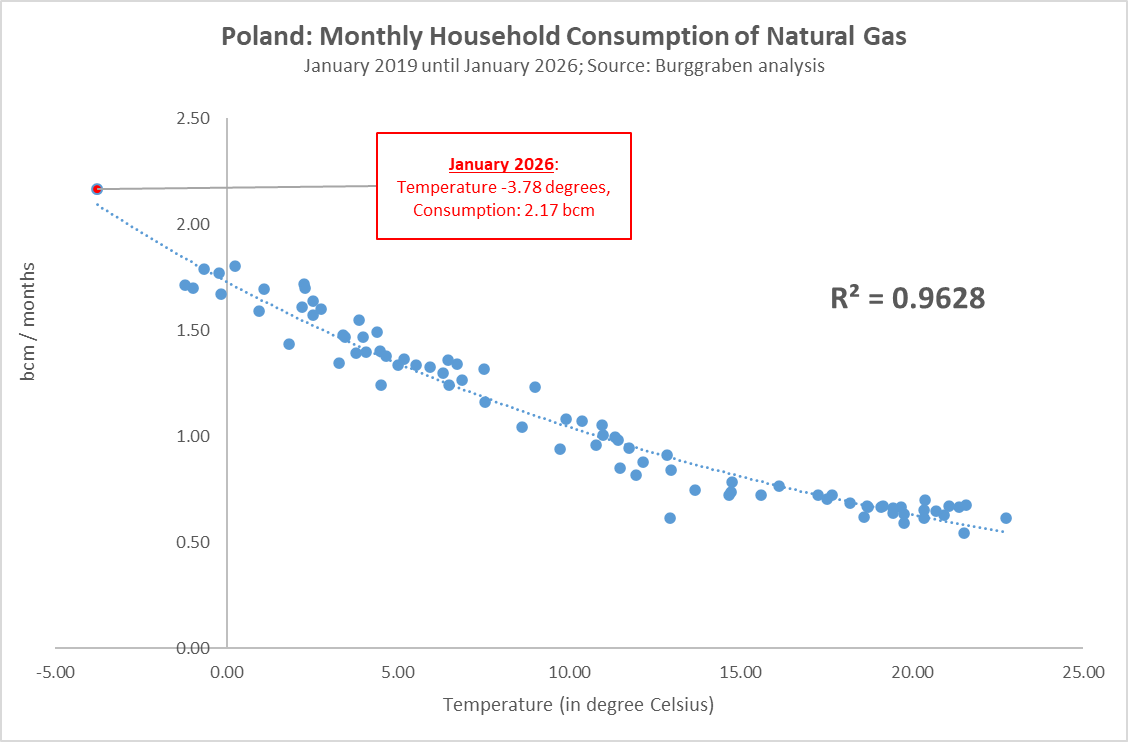
Consumption appeared subdued between winters 2022/23 and 2024/25. But those were mild winters, as the below charts illustrate for the examples of Germany and Poland. This season, however, marked a return to normal winter conditions in North-West Europe and below-normal cold in parts of Eastern Europe (see Poland below). That makes it the appropriate moment to test whether structural behavioural change has occurred.
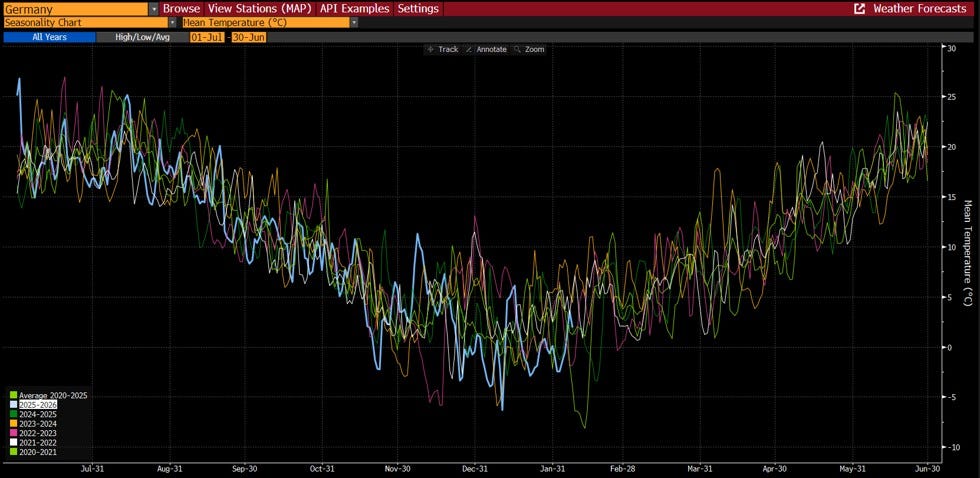
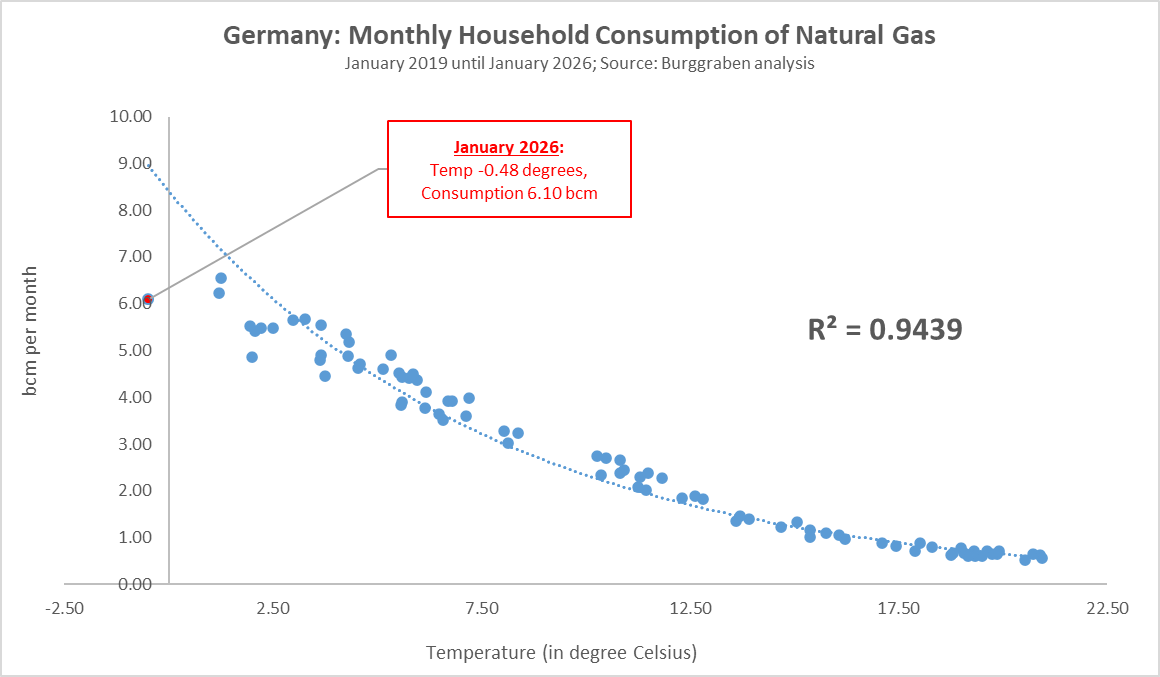
Running the analysis across all 28 countries, only Germany shows signs of a potential shift. German household consumption appears to plateau once temperatures fall below roughly 2.5°C. January 2026 provides the first meaningful data point supporting that observation. It is too early to call this permanent, but the pattern is noticeable.
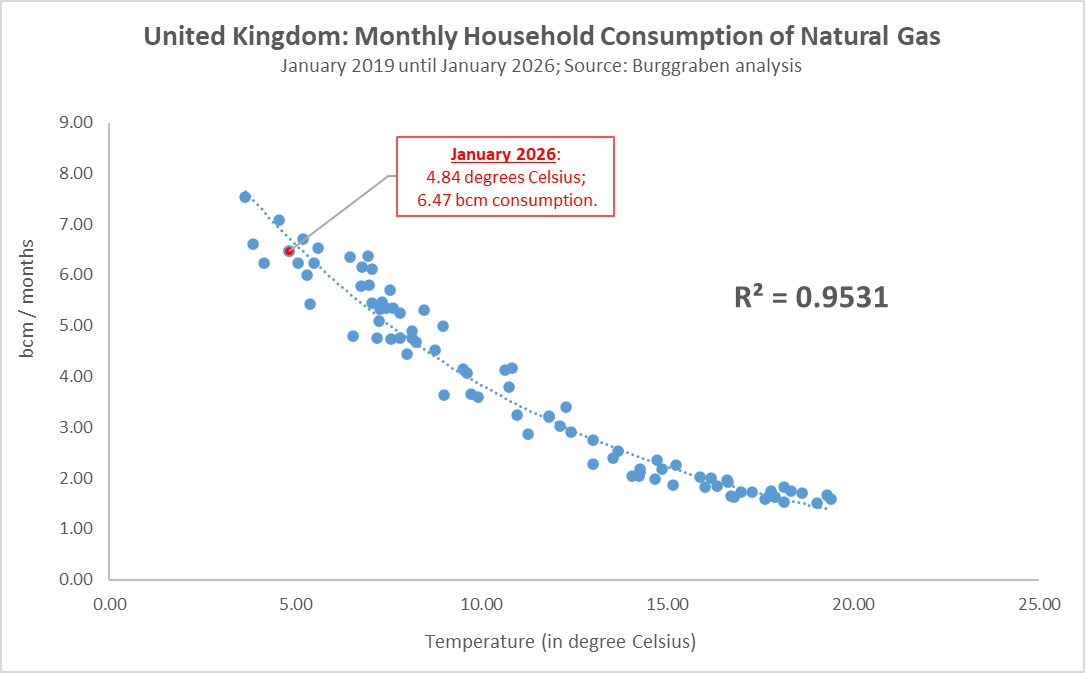
For all other countries, however, no structural change is visible.
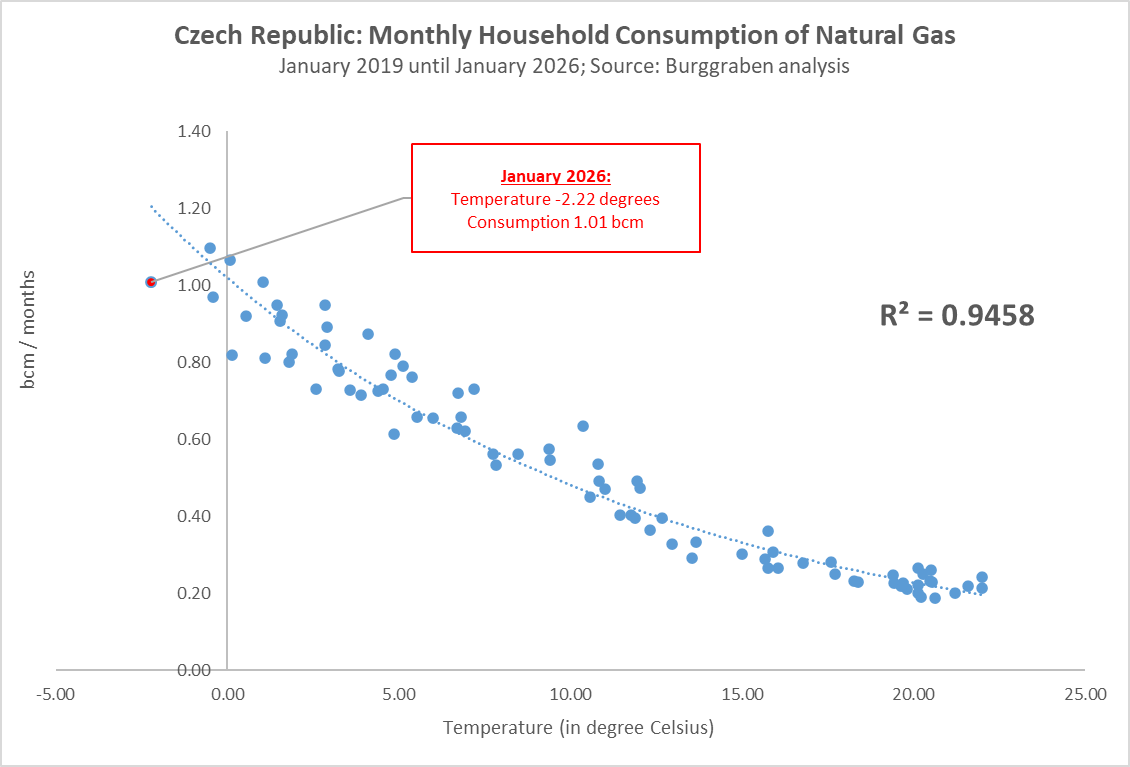
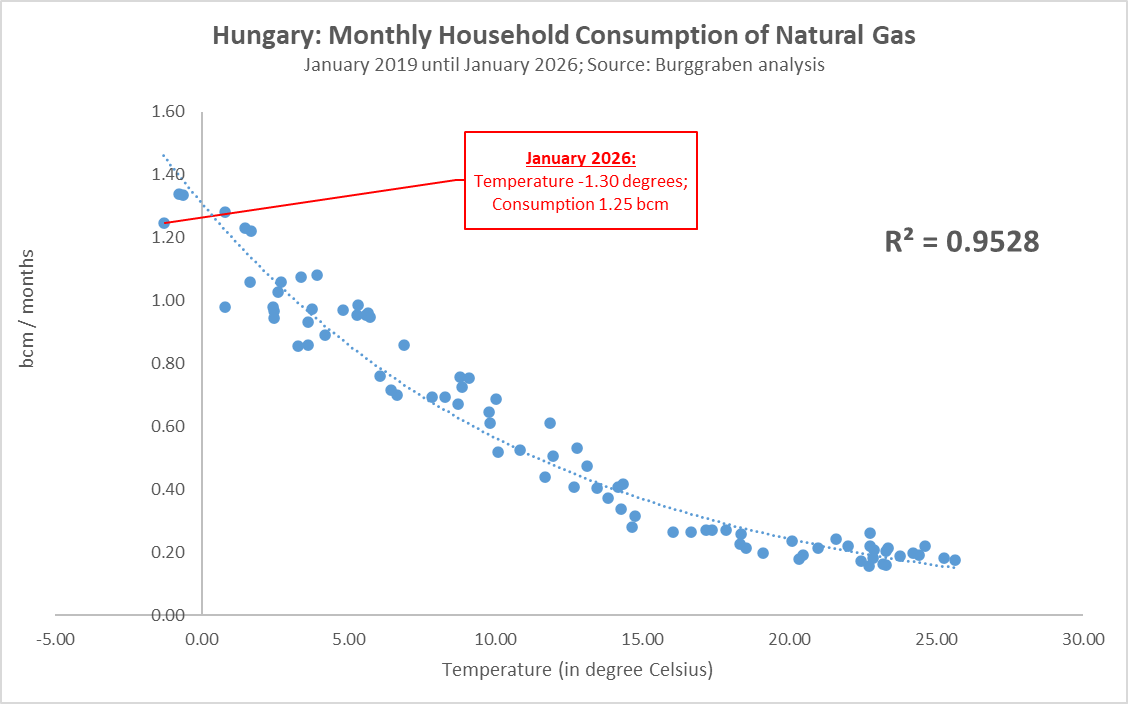
Below we illustrate the correlation between monthly temperature and gas consumption since January 2019 for a representative group: Germany, the United Kingdom, France, the Netherlands, Belgium, Italy, Spain, Poland, the Czech Republic, Hungary, Romania and Lithuania. January 2026 consumption is highlighted in red, representing the first genuinely cold winter month in the Post-Gazprom era.
These countries account for roughly 88% of European household gas consumption. There is no cherry-picking here.
The conclusion is straightforward. With the possible exception of Germany — and perhaps marginally the Netherlands — household consumption patterns remain temperature-driven. The loss of roughly 140bcm per annum of Gazprom pipeline gas has not materially altered heating behaviour.
Poland and Lithuania illustrate this most clearly. Colder temperatures translate into sharply higher gas consumption. The relationship remains intact.
A Note on Russian Gas Flows
Hungary and Slovakia continue to receive Russian pipeline gas via TurkStream. That must not be confused with Blue Stream or the Trans Adriatic Pipeline. In addition, Russian LNG cargoes still arrive in Spain and France. Russian gas imports remain unsanctioned in the EU, unlike oil and coal.
Serbia, though outside our perimeter and not part of TTF price formation, has recently sought to diversify away from Gazprom after failing to secure a new long-term contract last November. That development is politically notable, though not directly relevant for European hub pricing.
Back to natural gas.
Natural Gas Demand for Power Generation
Where we do observe meaningful change is in power generation.
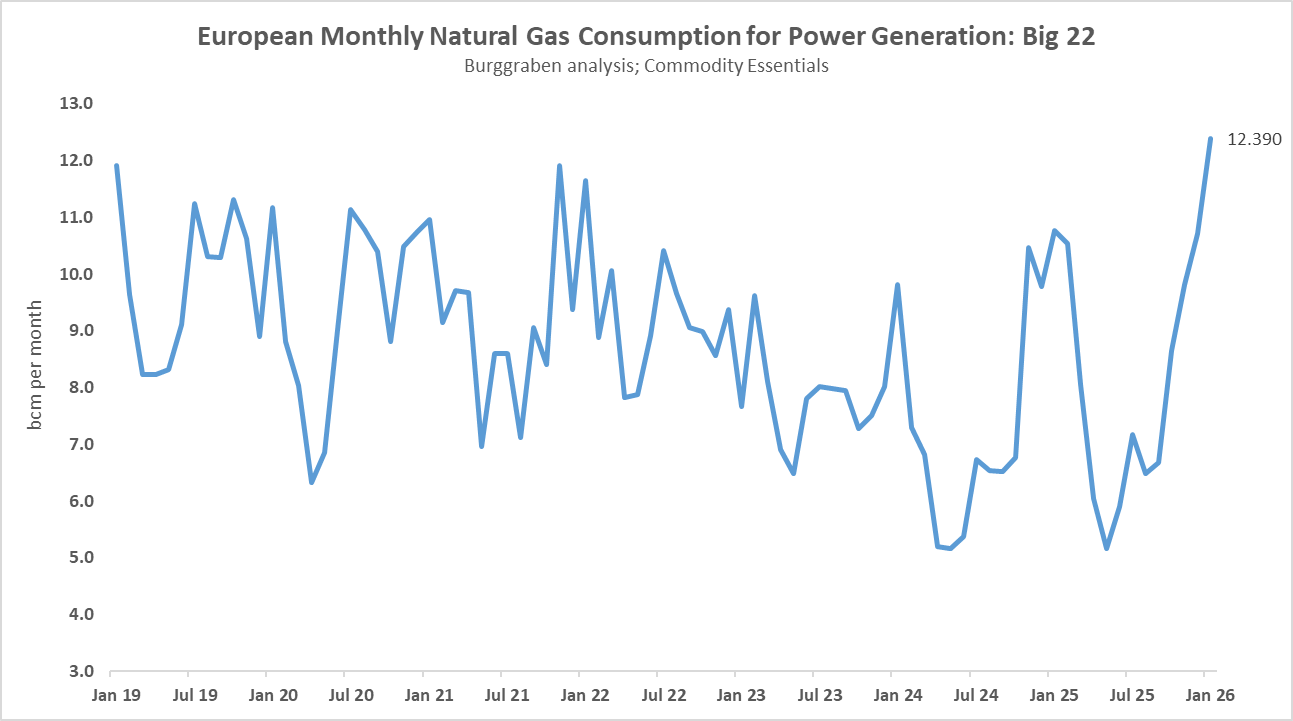
Utilities have reduced natural gas burn for electricity, but primarily during summer months, when wind and solar displace gas-fired turbines in the merit order.
That is the key distinction. The displacement is seasonal.
As the chart below for the 22 largest European markets illustrates, during Dunkelflauten — periods of low wind and solar output — Europe consumes more natural gas for power generation, not less. Dispatchable power must come from somewhere. Gas turbines remain the marginal stabiliser of the grid.
This dynamic is particularly visible in Germany, where nuclear output has fallen to zero. But it also applies to the United Kingdom, the Netherlands, Italy, Spain — where solar capacity has expanded rapidly — Belgium and even France.
As I have argued repeatedly, Europe requires dispatchable power to keep the lights on. Gas provides that flexibility. Wind and solar do not.
Natural Gas Demand for Industrial Use
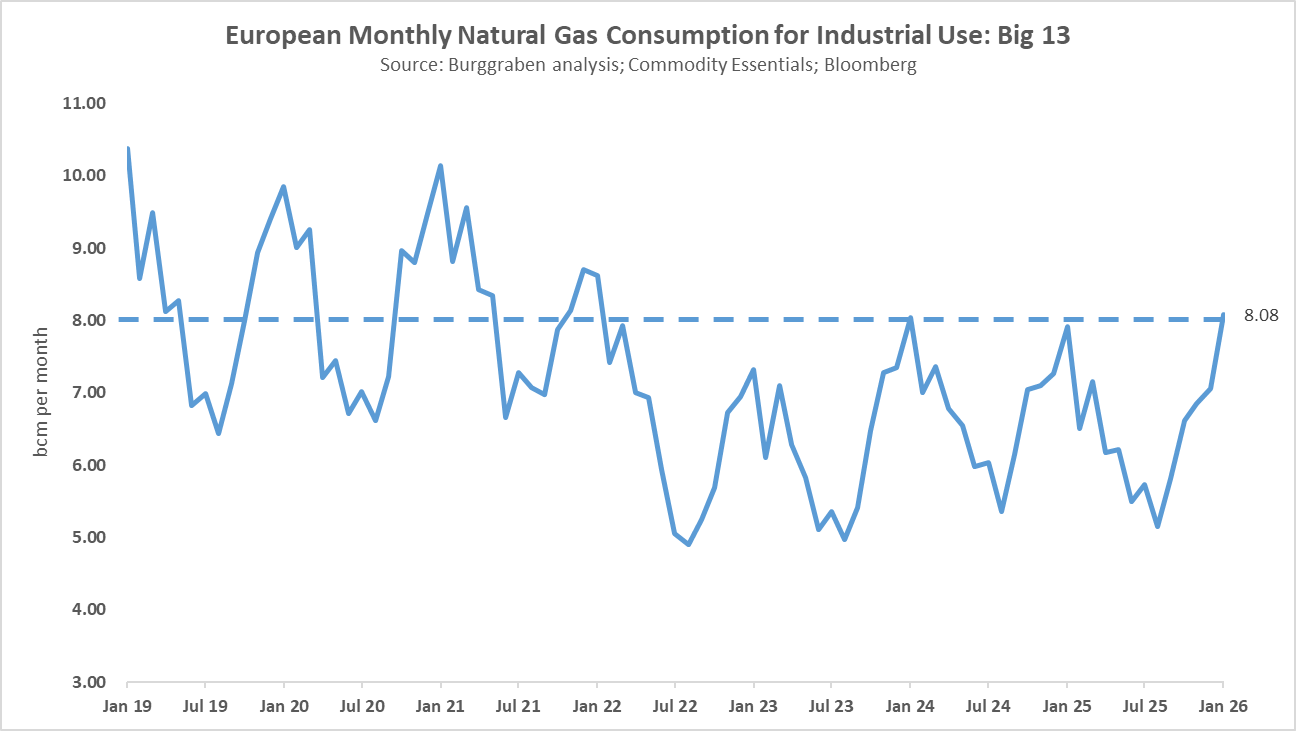
Industrial consumption tells a different story.
Gas use to heat factories and plants appears to have declined permanently, at least for now. Whether this reflects genuine efficiency gains, structural behavioural change or simply lower utilisation and outright closures is difficult to disentangle.
European industry — from chemicals to automotive manufacturing — was already struggling before the full impact of the Gazprom rupture in summer 2022. Since then, the sector has not meaningfully recovered.
The numbers reflect that reality.
Uneven Adjustment
In summary, the roughly 70bcm reduction in European gas consumption — from about 450bcm per annum in the Gazprom era to roughly 380bcm in the Post-Gazprom regime — has been highly uneven.
Household consumption for heating has barely changed, with the notable exception of Germany during extreme cold episodes. That may reflect structural adjustments in Germany’s long-term contracts, which include substantial retail and public-sector demand — schools, municipal buildings and mixed-use properties — potentially driving some peak suppression.
Several countries — notably the UK, Spain, Italy, the Netherlands and Belgium — have reduced gas burn in power generation during summer by expanding wind and solar capacity.
Germany, Poland and Ireland, however, have increased gas-fired generation. In Germany’s case, the reason is straightforward: the removal of nuclear capacity has reduced dispatchable supply. The remaining countries show little structural change in power-sector gas demand.
All countries have reduced industrial gas use. The open question is at what economic cost. I do not yet have a definitive answer. I am not entirely sure I will like it when I do.
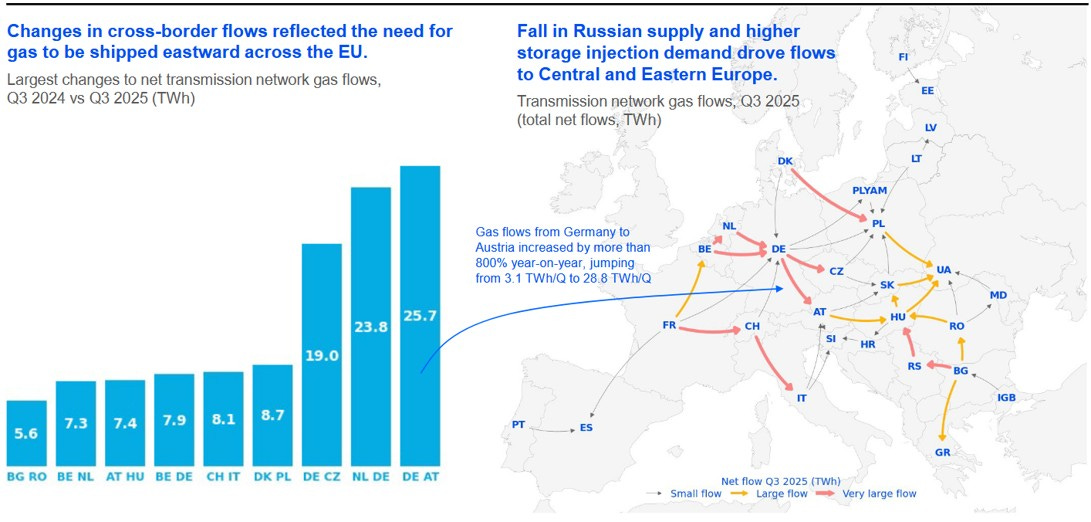
Flows Required Eastward
The Post-Gazprom regime has not only reduced volumes. It has reversed direction.
Before 2022, gas molecules entered Europe from multiple directions, with a substantial share flowing east to west.
Russian gas via Nord Stream entered Germany, feeding local consumption and transiting onward into the Czech Republic and France. The Yamal pipeline via Belarus supplied Poland and Germany. The Brotherhood pipeline — yes, that was its name — transited Ukraine into Slovakia and Hungary, serving local markets and moving further west through Austria into Italy. Finally, TurkStream delivered Russian gas into Greece, Bulgaria and Serbia, as well as parts of the Balkans.
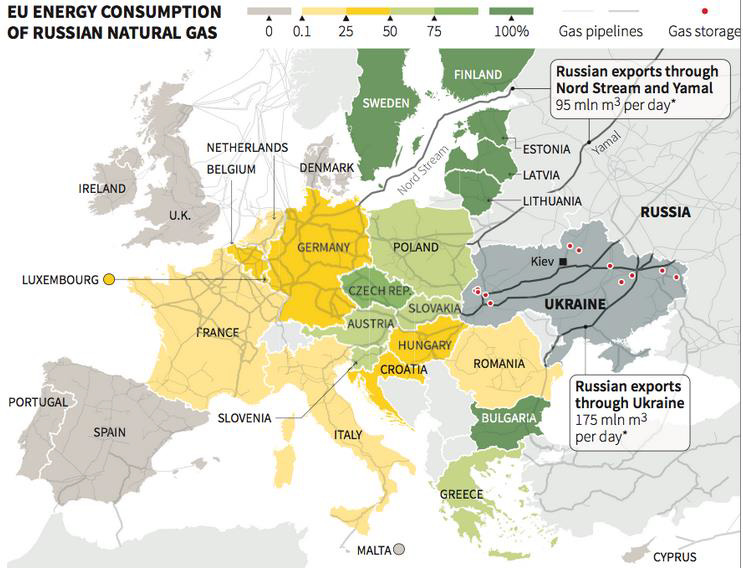
With the exception of TurkStream, these corridors have effectively ceased to function.
The system has had to reconfigure itself accordingly. Pipeline flows that once ran east to west now need to run west to east.
Norway, producing roughly 100bcm per annum and by far Europe’s largest remaining domestic supplier, now sends gas primarily into Germany, the Netherlands, Belgium and France. From there, molecules must transit further east — into Austria, the Czech Republic and Slovakia — to replace lost Russian volumes. Additional Norwegian gas now flows through Denmark via the Baltic Pipe into Poland.
This is not a minor adjustment in routing. It is a structural reversal of flow patterns that were built over decades.
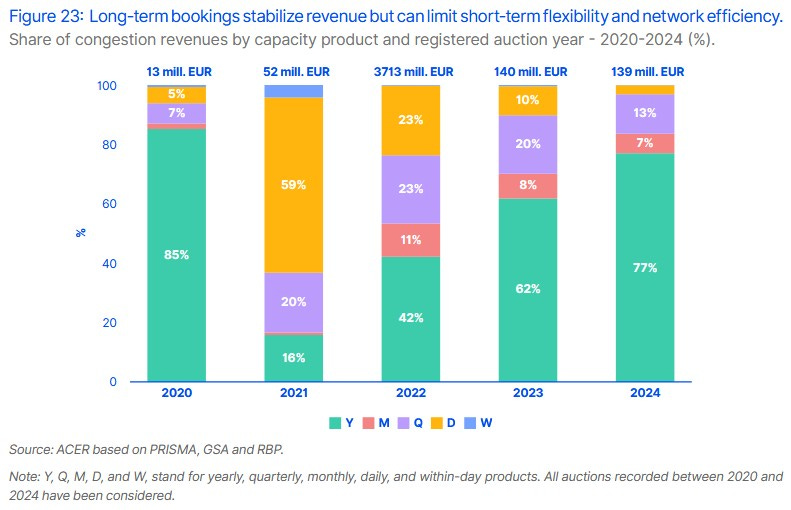
Unsurprisingly, such reconfiguration has generated friction. ACER, the European regulator, measures this in congestion revenues. These peaked at more than €3.7bn in 2022 before declining to around €140m more recently. That reduction is encouraging.
But falling congestion revenues do not mean the system is fully adapted. Infrastructure built over 70 years does not reconfigure itself seamlessly within three.
Vulnerabilities remain.
One area where this is most visible is LNG import capacity in Germany, Poland and the Baltic states. The easiest way to illustrate this is to revisit the Coverage Ratio — this time applied to German balances.
Germany was the country most exposed to the Kremlin’s attempt to weaponise gas supplies. That vulnerability was amplified by policy choices stretching back years.
Angela Merkel’s doctrine of Wandel durch Handel — change through trade — sought to integrate Russia into the liberal economic order. In practice, it increased dependence on a single supplier. When the rupture came in 2022, the “Wandel” indeed arrived, though not in the intended sense.
I state this without irony. Germany’s resilience matters enormously for Europe. But shutting down roughly 150TWh of nuclear dispatchable capacity while deepening reliance on Russian gas was a profound strategic error. There is no softer way to phrase it.
Back to natural gas.
The German Causa
The German balance sheet illustrates the structural shift more clearly than any other country. We run these balances for all 28 countries, but Germany is the extreme case.
Germany is the central hub of the continental gas system. Without it, landlocked countries such as Austria, the Czech Republic, Slovakia and, to a degree, even Switzerland would struggle to secure sufficient supply.
In 2020, Germany received roughly 80bcm of Russian gas via Nord Stream and Yamal. Within two years, those flows vanished.
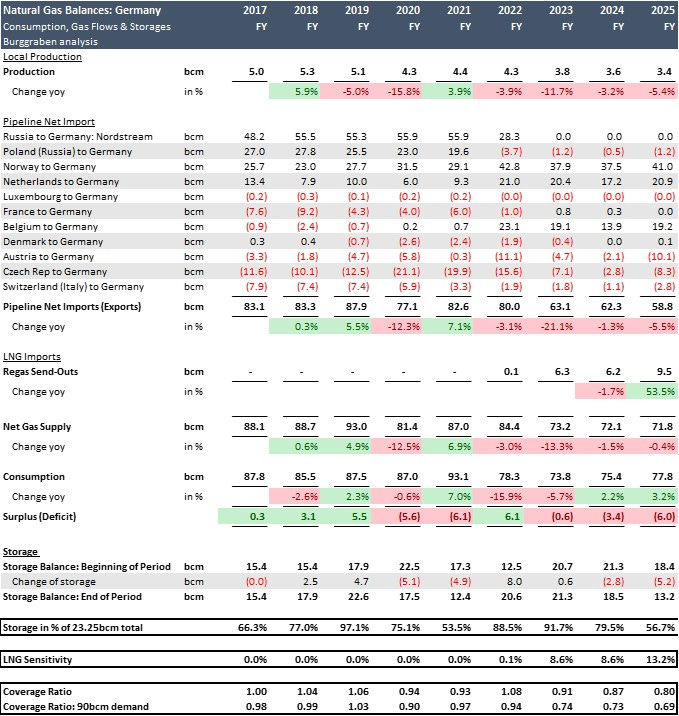
Germany responded by reducing baseline consumption from roughly 90bcm to 70bcm by 2025, a 22% contraction. That alone is extraordinary.
After that demand adjustment, around 60bcm still needed to be rebalanced.
By 2025, Norwegian inflows had increased from roughly 30bcm to 60bcm. Of that, about 40bcm arrived directly via pipelines landing at Emden and Dornum, which together have 54bcm technical capacity. A further 20bcm was effectively redirected via transit flows through the Netherlands and Belgium.
Around 10bcm came from newly built LNG terminals.
The remaining gap was closed by reducing export deliveries to France, Italy — transited via Switzerland — and the Czech Republic, including onward transit to Slovakia and Hungary.
But the system has not simply rebalanced internally. Germany now supplies more gas eastward to Austria and modest volumes to Poland, instead of receiving large east-to-west flows from Russia via Poland. It no longer supplies certain Belgian pockets either.
The question, then, is not whether Germany survived the rupture. It did. The question is at what cost — and with what structural fragility. A 22% forced reduction in consumption is rarely benign. Germany’s industrial slowdown did not occur in a vacuum.
The Coverage Problem
The deeper issue lies in Germany’s summer refill capacity.
Before 2022, Germany’s Coverage Ratio — pipeline imports plus domestic production divided by consumption — hovered around 1.0x in summer. In other words, baseline supply was broadly sufficient to cover demand and allow net injections into storage.
Today, that ratio is closer to 0.8x. Had consumption remained at 90bcm, it would be nearer 0.7x.
That difference matters.
Lower structural coverage means reduced net injection capacity during summer, even after adding roughly 10bcm of LNG imports.
In practical terms, Germany must now work harder to refill storage than it did pre-2022.
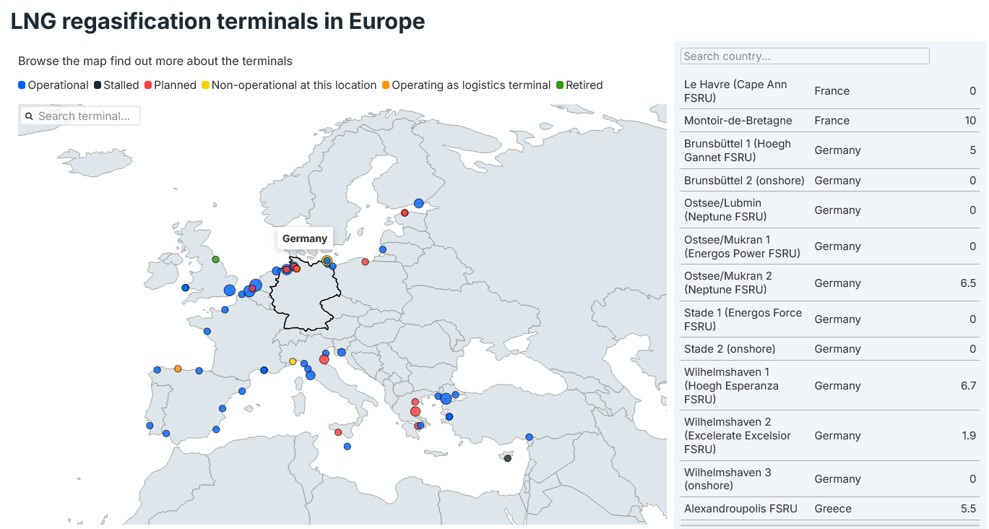
The State of German LNG
Germany likely requires at least 20bcm of LNG imports per annum to replenish deeply depleted storage. Thirty would provide far greater security, not only for Germany but also for its landlocked neighbours. Can it deliver?
Well, German LNG import capacity remains a moving target.
There are currently five terminals in various states of operation or development. Lubmin — located at the former Nord Stream landfall and therefore ideally positioned within the pipeline grid — was effectively abandoned after a short operational period and consolidated at Mukran under Deutsche Regas.
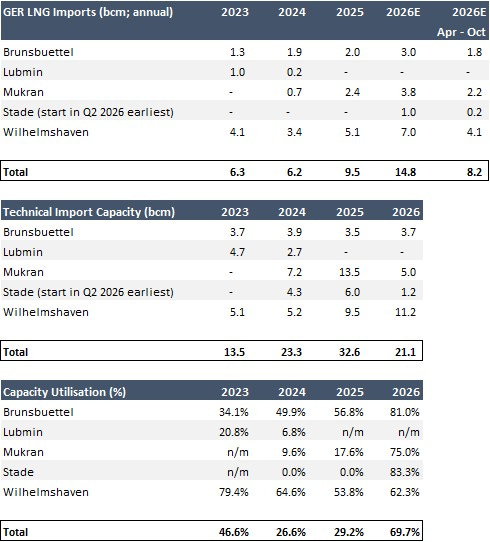
Mukran, the biggest terminal on paper, has a technically “approved” capacity of 13.5bcm per annum. However, it operated at only 17.6% utilisation in 2025. That is well below what was politically promised. Why?
The Mukran LNG import terminal originally planned two floating storage and regasification units (FSRUs) to achieve its approved annual capacity of about 13.5bcm as outlined above. But only one vessel (Neptune) with a capacity of 5bcm per annum is currently in operation, which operator Deutsche ReGas isn’t keen to explain explicitly on its Website.
A second FSRU, the Energos Power (174,000 m³), was previously deployed but its charter contract was terminated in early 2025. Deutsche ReGas ended the Energos Power FSRU agreement with the German Federal Ministry for Economic Affairs and Climate Protection, citing pricing distortions and competitive disadvantages introduced by state-backed LNG terminals, which were offering capacities at below cost-covering fees approved by the regulator.
Stade, the state-backed 6bcm FSRU project, remains delayed and is unlikely to enter operation before Q2 2026. Wilhelmshaven and Brunsbüttel are functioning but require materially higher utilisation to provide meaningful refill support.
Based on current trajectories, Germany may import no more than roughly 14.8bcm of LNG in 2026. That is for the full year. For the summer period between 1 April to 31 October, the number is likely 8.2bcm, according to our calculations. Is that sufficient to refill 23bcm of storage capacity by October?
Unlikely and as the table below illustrates. More concretely, we assume Germany can inject 15bcm into its storages during the summer months. Were it to exit the winter at our assumed 3.2bcm at the end of March, that brings it to 18.2bcm by the end of October - 78.5%-filled.
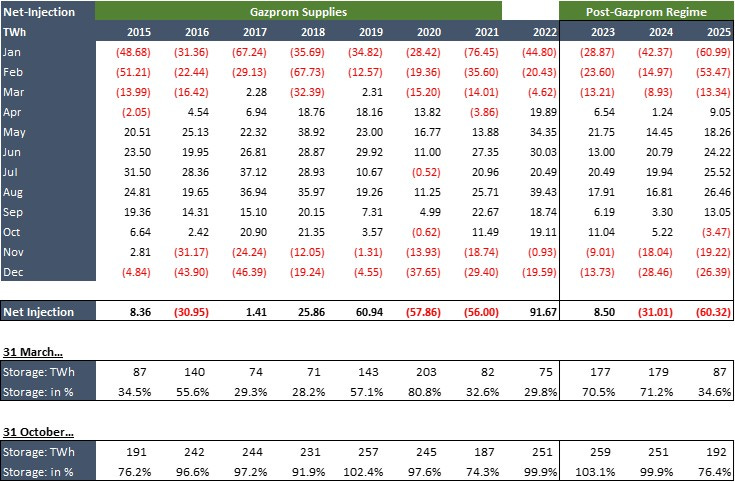
In the Post-Gazprom regime, Germany achieved strong net injections only in 2023, when storage stood at 70.5% as of 31 March. In both 2024 and 2025, net injection performance was weaker.
Our current forecast suggests German storage could fall to roughly 13.7% by 31 March. Refilling from that base to 90% is materially more demanding than in prior years. Those are simply the numbers.
Given those numbers, the German regulator would be wise to ensure that inadequate time spreads do not become the binding constraint on refill economics.
The Technical Question
To be clear, we are not arguing that Germany cannot technically refill storage to 23bcm by end-October.
We have stress-tested this question from a capacity and congestion perspective and conclude that Germany, in theory, should be able to inject enough gas between 1 April and 31 October to refill its storages.
However, technically possible does not equal commercially realised or practically feasible, and as illustrated for the Murkan regas terminal capacity of only 5bcm, not the approved 13.5bcm per annum.
What is required is sufficient upstream flows, adequate LNG utilisation, and functional west-to-east transit throughout the system, not “approved capacities”. When measured this way, we get to 15bcm of net-injection forecast between 1 April and 31 October 2026. And Germany does not have it where we sit.
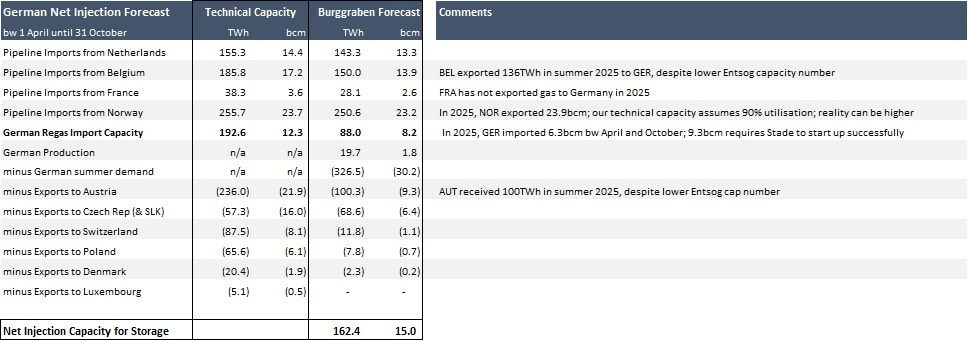
Please note that the above table assumes 8.2bcm of LNG imports during April to October at German regasification terminals. For the same period in 2025, they imported 6.3bcm. We thus assume 30% year-over-year growth. That may prove to be too optimistic still.
Furthermore, we assume seamless imports from Norway, which is not a given either if any of the big fields like the Troll field has to undertake unplanned maintenance work. We also assume 2.6bcm pipeline imports from France, which has not been the case in 2025 and will require the latter to import more LNG on behave of Germany, the logic of which we cannot judge commercially.
Which brings us to the real question. Can Europe refill storage in every corner of the continent by October 2026 and enter winter 2026/27 prepared for a below-normal cold season? That is the only question that matters.
The European Natural Gas Puzzle
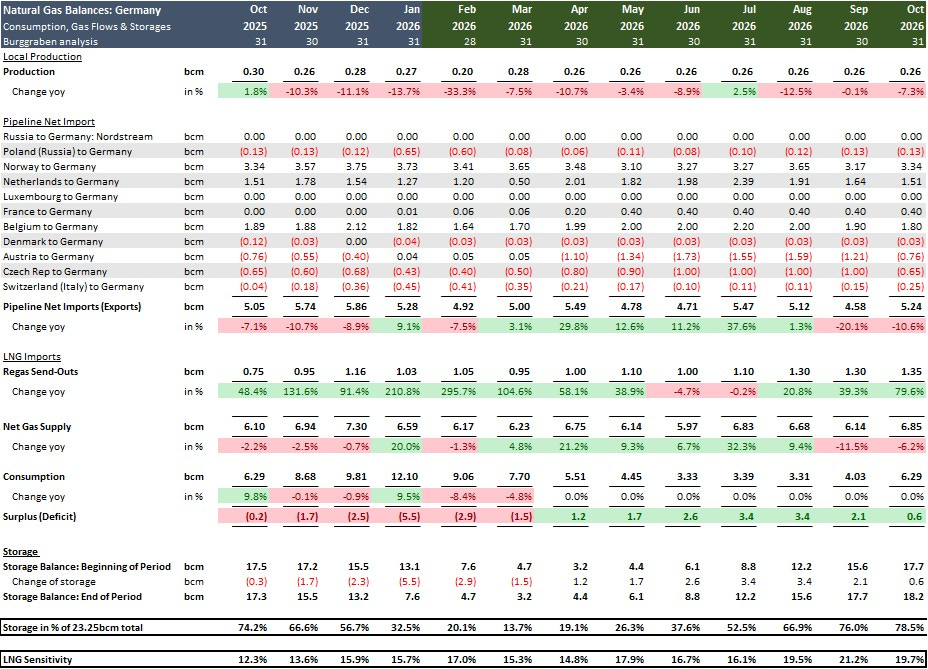
The proper way to analyse the European summer balance is to begin with what we know with reasonable certainty, then progressively fill in the gaps from the known to the uncertain at country level until the full picture emerges.
The highest “known known” is Norwegian supply. Between now and 31 October, we expect roughly 72bcm of Norwegian gas to enter the European system. We know the technical pipeline capacities and we broadly understand the distribution pattern among clients: Germany typically receives 35–39% per month, the UK 13–24%, Belgium 3–15%, France 12–15%, Poland via Denmark 6–9% and the Netherlands 4–10%. Monthly nominations fluctuate, but this provides a solid starting grid.
Our model forecasts country-level consumption for households, power and industry with reasonable precision. That determines which countries without storage must receive flows from countries with storage. Germany, for example, must supply roughly 1bcm to Switzerland between February and April under our base case. Similar balancing flows occur throughout the system.
We also know regasification capacities, North African pipeline inflows, Azeri volumes and domestic production profiles.
From there, the puzzle can be assembled.
Spain and Portugal are effectively self-contained systems. LNG is the balancing item, storage less so. Greece operates similarly. Italy is comparatively easy to ring-fence given stable North African and Azeri pipeline inflows combined with ample LNG capacity. Romania remains largely self-sufficient due to domestic production.
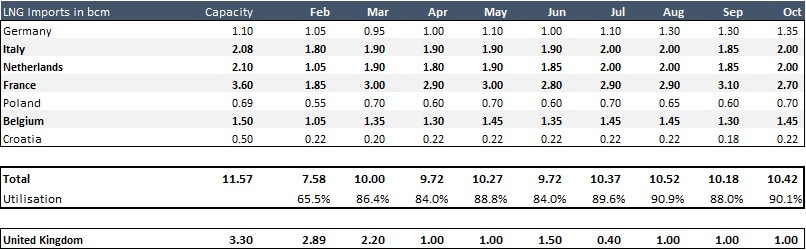
The UK is near self-sufficient thanks to domestic output, steady Norwegian inflows and significant LNG capacity of up to 3.1bcm per month. It uses minimal seasonal storage. The Nordics are small in gas terms. The Baltics are systemically minor.
Once these higher-certainty components are locked in, we can iterate country-by-country flows and derive the LNG volumes required to maximise storage levels by 31 October across the major hubs.
The result is sobering.
Under current assumptions, four of the seven biggest EU storage-capacity countries remain materially below the 80% October target: Germany, the Netherlands, Austria and the Czech Republic.
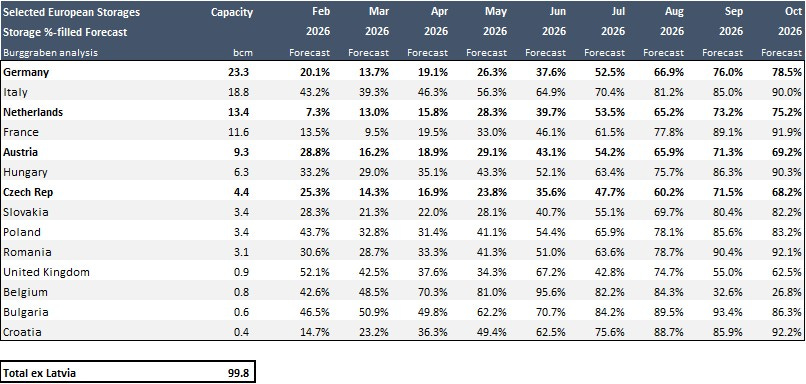
Yes, Belgium and the UK show similar profiles, but their storage volumes are too small to function as true seasonal buffers. They operate more like short-term balancing tanks, as we have them at regas terminals. Systemically, however, they are secondary for natural gas supply-security during winters.
Importantly, our projections assume elevated — though manageable — LNG imports throughout summer. France and Belgium, in particular, would need to operate near regas capacity for prolonged periods. That has not yet been tested in a sustained, routine fashion.
Beyond Germany’s vulnerability, allow me some more observations.
Take the Netherlands.
Why accept a structural gamble on weather and LNG terminal availability? Why shut down Groningen entirely rather than maintain limited production as strategic insurance? Why reduce nuclear output rather than reduce gas-fired generation if decarbonisation is the objective?
Dutch policy appears internally inconsistent. It is a bet on wind, a bet on LNG availability and a bet on mild winters — all in a highly industrialised economy that depends on energy reliability. Energy security is not a domain for optimism bias.
The UK illustrates a different version of fragility.
It is Europe’s third-largest gas consumer at roughly 55.4bcm in 2025, behind only Germany and Italy. Households rely heavily on gas for heating and cooking. The power grid relies heavily on gas when offshore wind output falls — which it does regularly.
Domestic production has fallen from 36.2bcm to 29bcm in 2025 and may drop below 26bcm in 2026. The Energy Profits Levy, introduced post-Gazprom, has materially dampened new upstream investment. Production decline was already structural. The levy accelerated it.
Meanwhile, the UK possesses just 0.9bcm of storage. For a 56bcm market, that is symbolic. A one-week unplanned outage at Norway’s Troll field during winter would be enough to create acute stress. The margin for error is thin, while the Continent does not seem capable anymore to help under any circumstances.
Under our forecast, the UK must import roughly 2.9bcm of LNG in February alone to remain balanced. That is dependency instead of redundancy.
France presents a different problem.
It entered winter at roughly 90%-filled storage, then drew down during a relatively mild November instead of maximising LNG imports and preserving storage optionality. That choice now forces elevated LNG requirements later in the season.
Our projections require roughly 1.8bcm of LNG in February and around 3.0bcm and 2.9bcm in March and April, respectively. The 2022 crisis peak monthly import was 3.6bcm. France must operate close to that level again, while avoiding unnecessary exports to Spain. This could have been mitigated with more conservative refill behaviour.
It also, in our assumption, must import about 0.4bcm more LNG monthly to export gas to Germany. A novum the commercial feasibility of which we cannot judge.
France looks as if it either requires greater LNG regas capacity, larger storage buffers, or a more disciplined injection strategy. The current configuration leaves limited room for error in a below-normal January or February.
System Fragility
The broader conclusion is uncomfortable.
The European system now operates with thinner margins than a decade ago. A combination of events — an unplanned outage at a major Norwegian field, temporary LNG terminal disruption in the UK, France, Belgium or the Netherlands, or a sustained below-normal cold spell — would place the system under acute strain by March.
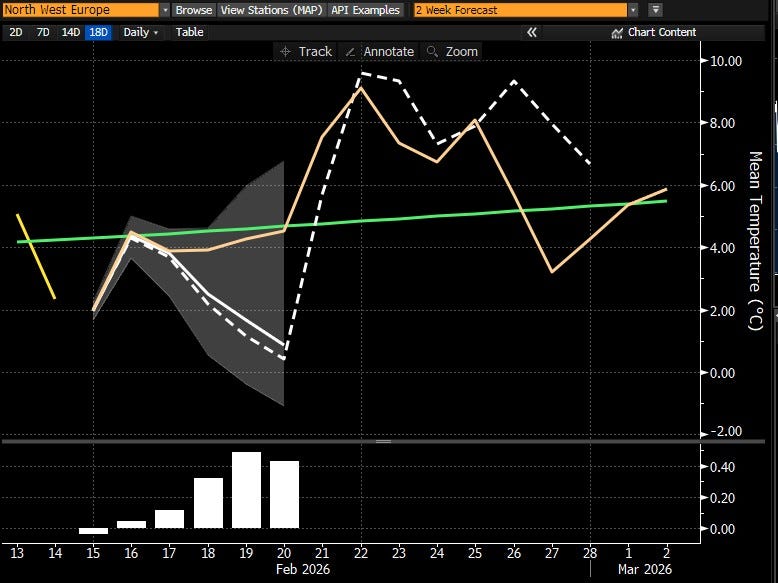
Under such circumstances, curtailments would likely occur at industrial level first. For now, the February outlook suggests moderate conditions in North-West Europe. The weather remains cooperative.
But reliance on cooperative weather is not a strategy. The real question is whether Europe is comfortable running a structurally tighter system indefinitely — and whether the next winter will be equally forgiving.
Executive Summary
That, ladies and gentlemen, is the current state of the European natural gas market.
Europe will have access to ample and increasingly cheap LNG on the global spot market. The glut is real. But especially in North-West Europe — the Netherlands, Belgium and Germany — as well as in Poland and Greece, usable import capacity must increase materially if these countries are to benefit fully from it.
Approved capacity is not the same as operational capacity. Technical nameplate is not the same as actual throughput.
Insufficient Coverage Ratios — local production plus pipeline flows relative to consumption — combined with limited usable LNG capacity mean that not every country will automatically refill storage by October at attractive prices. Not until storage rules are rationalised and supply-side bottlenecks, both in gas and electricity, are addressed.
The overarching issue is not the absence of Russian pipeline gas. That source was always geopolitically unreliable. The real issue is poorly conceived top-down policy that reduced domestic production without delivering credible replacement capacity in the name of energy security or affordability.
European households still consume roughly as much gas as they did before the Gazprom rupture. Industrial demand, however, has fallen — partly by design, partly because parts of European industry were priced out of global competition. The de-industrialisation debate is no longer theoretical.
European policymakers would do well to acknowledge these realities and recalibrate. Lower utility bills require supply expansion across all energy forms, with the market determining the efficient mix. Artificial scarcity is not climate policy. It is cost inflation.
From where I sit, the unilateral pursuit of aggressive fossil fuel exit targets under the Green Deal is neither affordable nor strategically coherent in the current geopolitical environment — especially as Europe is simultaneously expected to increase defence spending and maintain extensive social commitments.
Europe cannot re-arm, decarbonise at maximum speed and preserve its existing welfare architecture without trade-offs. Something will give.
The global economy has shifted. What David Baverez calls the transition from a peace economy to a war economy is not rhetorical flourish. The former was built on demand growth, cost optimisation and global cooperation. The latter is shaped by supply constraints, geopolitical leverage and strategic autonomy.
Energy sits at the centre of that transition. For investors, this shift has consequences, not least for commodity producers and real asset exposure, which we analyse regularly on this Substack.
Bringing it back to gas.
In the Post-Gazprom regime, Europe must enter winter with storage levels comfortably above 90% to avoid renewed March stress. Frankly, 95% would provide a far healthier buffer given the structurally lower Coverage Ratio.
That objective would likely be achieved more efficiently by allowing timespreads to function properly rather than through rigid storage mandates.
Beyond that, Europe should consider establishing a true strategic gas reserve of roughly 37–40bcm — around 10% of annual consumption — analogous to the US Strategic Petroleum Reserve. Such a buffer could be drawn during system stress and replenished when conditions normalise.
That may be the most rational lesson from this winter.
Warm regards,
Alexander Stahel
PS: Press the heart if this analysis added value.
PPS: And tell me if you’ve seen a better deep dive on European natural gas. I’ll wait.
Magisterial as ever. Thought this might be of interest: https://ember-energy.org/latest-insights/hot-stuff-geothermal-energy-in-europe/
Thanks again Alexander, Hope they read this in london, the hague, brussels and berlin