


“The problem of oil, it might be tersely said, is that there is always too much
or too little.” Myron Watkins, Oil: Stabilization or Conservation? 1937
1. The UAE Left OPEC — Now What?
After fifty-nine years of membership, the UAE walked out of OPEC on 1 May 2026. The decision is about far more than production quotas, recent rifts with Riyadh, or wartime disruption. It reflects structural changes in global energy and in the world economy — and a clear-eyed Emirati view of where the country stands and where it is going.
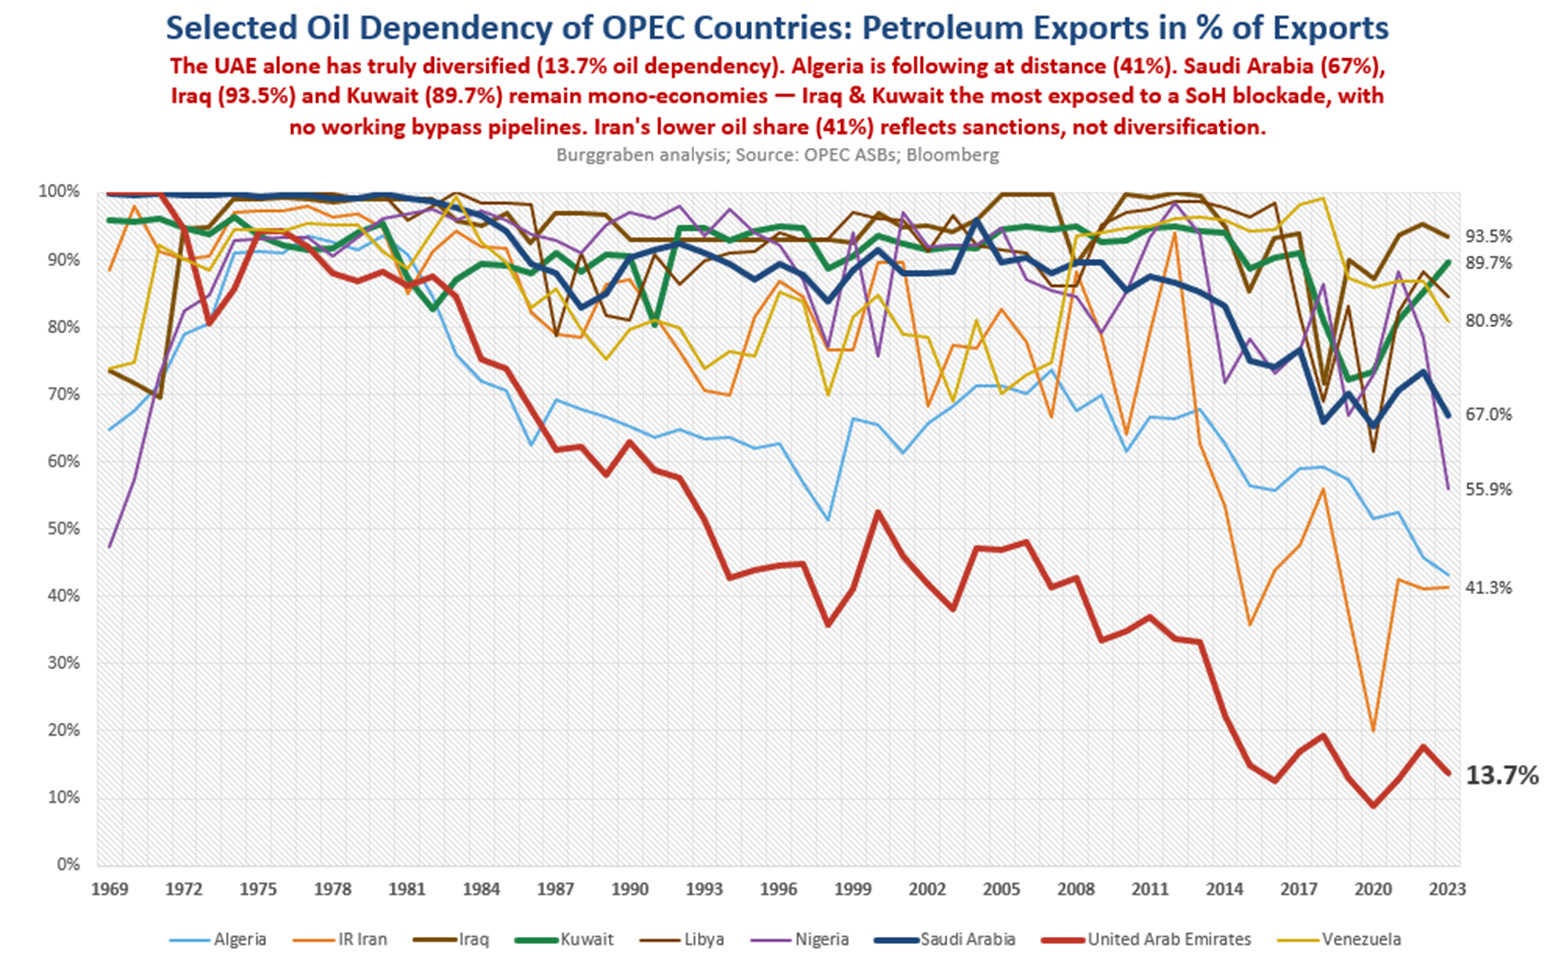
OPEC was built for oil-dependent states. Abu Dhabi joined in November 1967, four years before the UAE existed as a nation. As a young federation, its economy depended entirely on oil revenue, and OPEC’s framework — collective production management, shared discipline, co-ordinated pricing — offered the expertise, stability and leverage that a small, newly independent country could not generate on its own. But that country no longer exists.
Less than a quarter of UAE GDP is now tied to energy. Aviation, logistics, advanced manufacturing, AI, tourism, and life sciences are its fastest-growing sectors. Just as telling, the Barakah nuclear plant — the Arab world’s first — has been operational since 2020 and now generates clean baseload power across four APR-1400 units totalling 5.4GW of nameplate capacity. For context: Finland has 4.4GW, Switzerland 3.0GW.
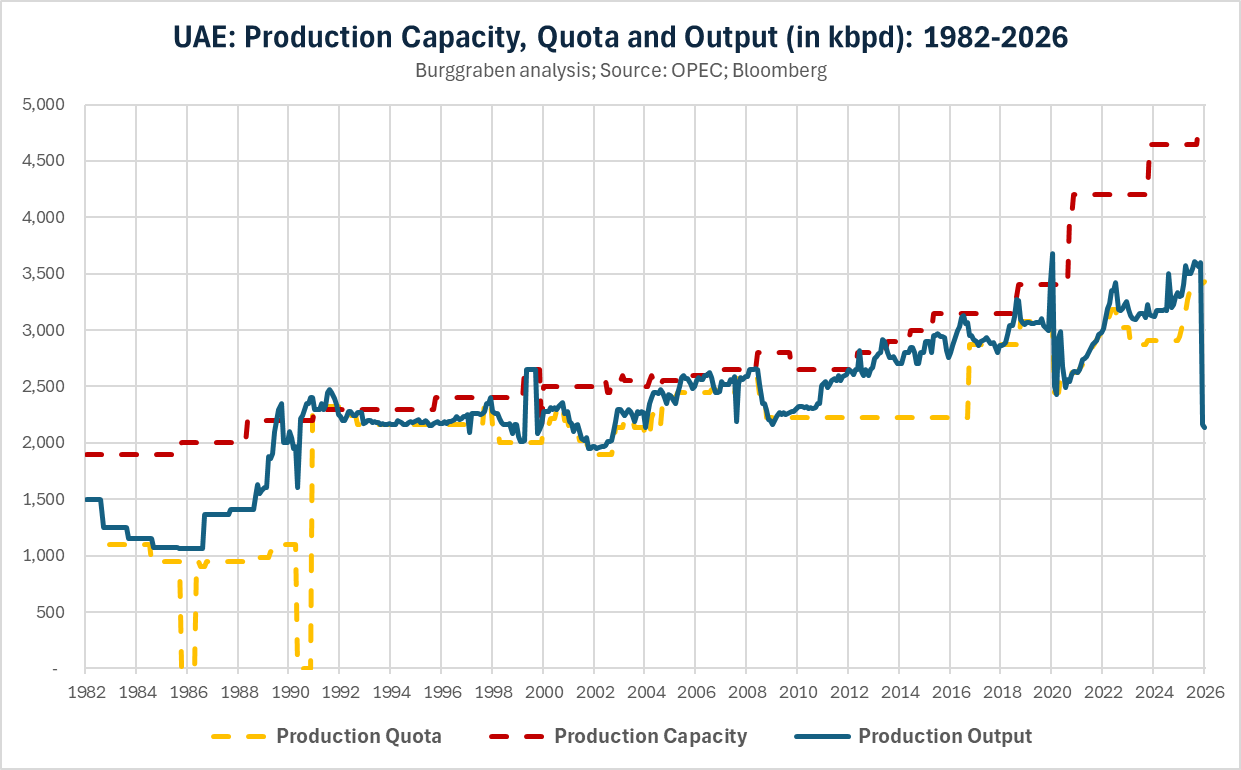
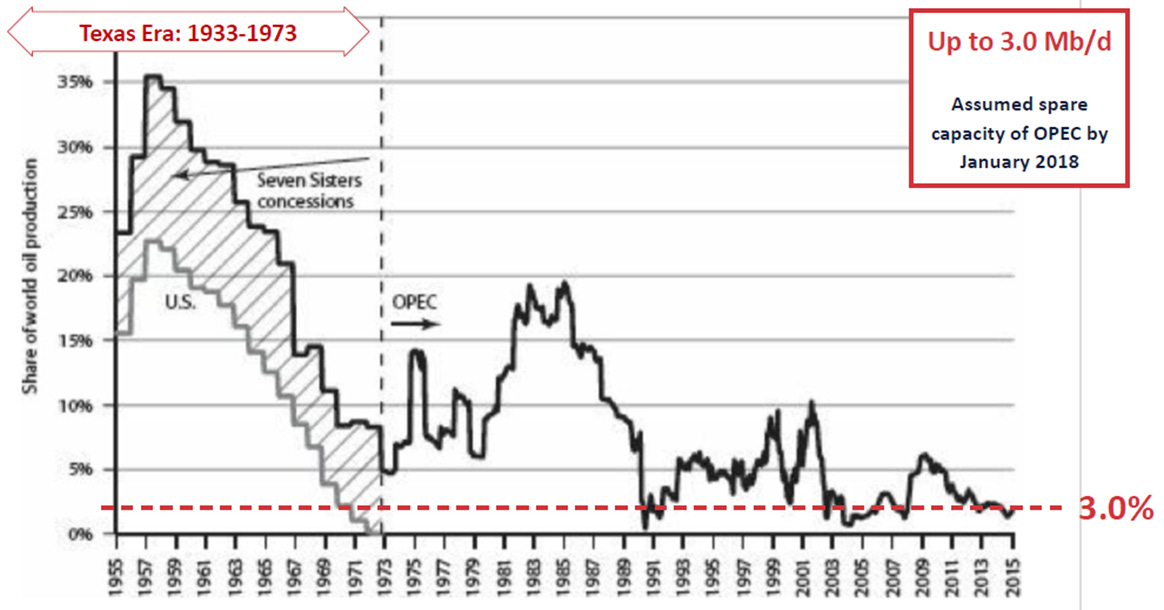
Meanwhile ADNOC has built crude capacity to 4.85mbpd and is targeting 5mbpd by 2027 — most of the growth from the Upper Zakum development in partnership with ExxonMobil. Pre-war UAE production sat at roughly 3.5mbpd, the level set by OPEC quota. That is 1.35mbpd of spare capacity sitting idle — on the same order of magnitude as Saudi Arabia’s, and tens of billions of dollars of upstream investment held hostage to a system the country has outgrown.
Leaving OPEC, therefore, is not a commercial calculation. It is a responsibility towards Emirati citizens — to develop the economy beyond oil rather than write down sunk capital deployed for a future the cartel will not allow them to deliver.
The exit was the plan all along. Oil revenue was always a means to an end; the goal was never to be an oil state. It was to build something more enduring — a diversified economy, a knowledge society, a country deep enough and partnered widely enough to thrive in whatever the world becomes next. One can only hope it stays the course, especially in these testing times. Without the UAE as a credible model, which Arab state can the others realistically emulate, for the long-term benefit of all of its people?
The decision may have surprised casual observers and even the Saudis in the moment. But it surprised no long-time oil market insider, and the timing was perfect. Flooding the market — the threat Crown Prince Mohammed bin Salman, whose ambitions and grievances outrun his wisdom, used in March 2020 against OPEC+ member Russia — requires barrels that can leave the Gulf, and right now nobody’s can, Saudi Arabia’s included.
Nor is there genuine uncertainty about what it means. The UAE exit marks the end of OPEC as we know it — Saudi Arabia now loses one of only two production allies with substantial swing capacity. Yet beyond the blow to Riyadh’s global political reach, it will have surprisingly little practical consequence for oil markets, if any at all.
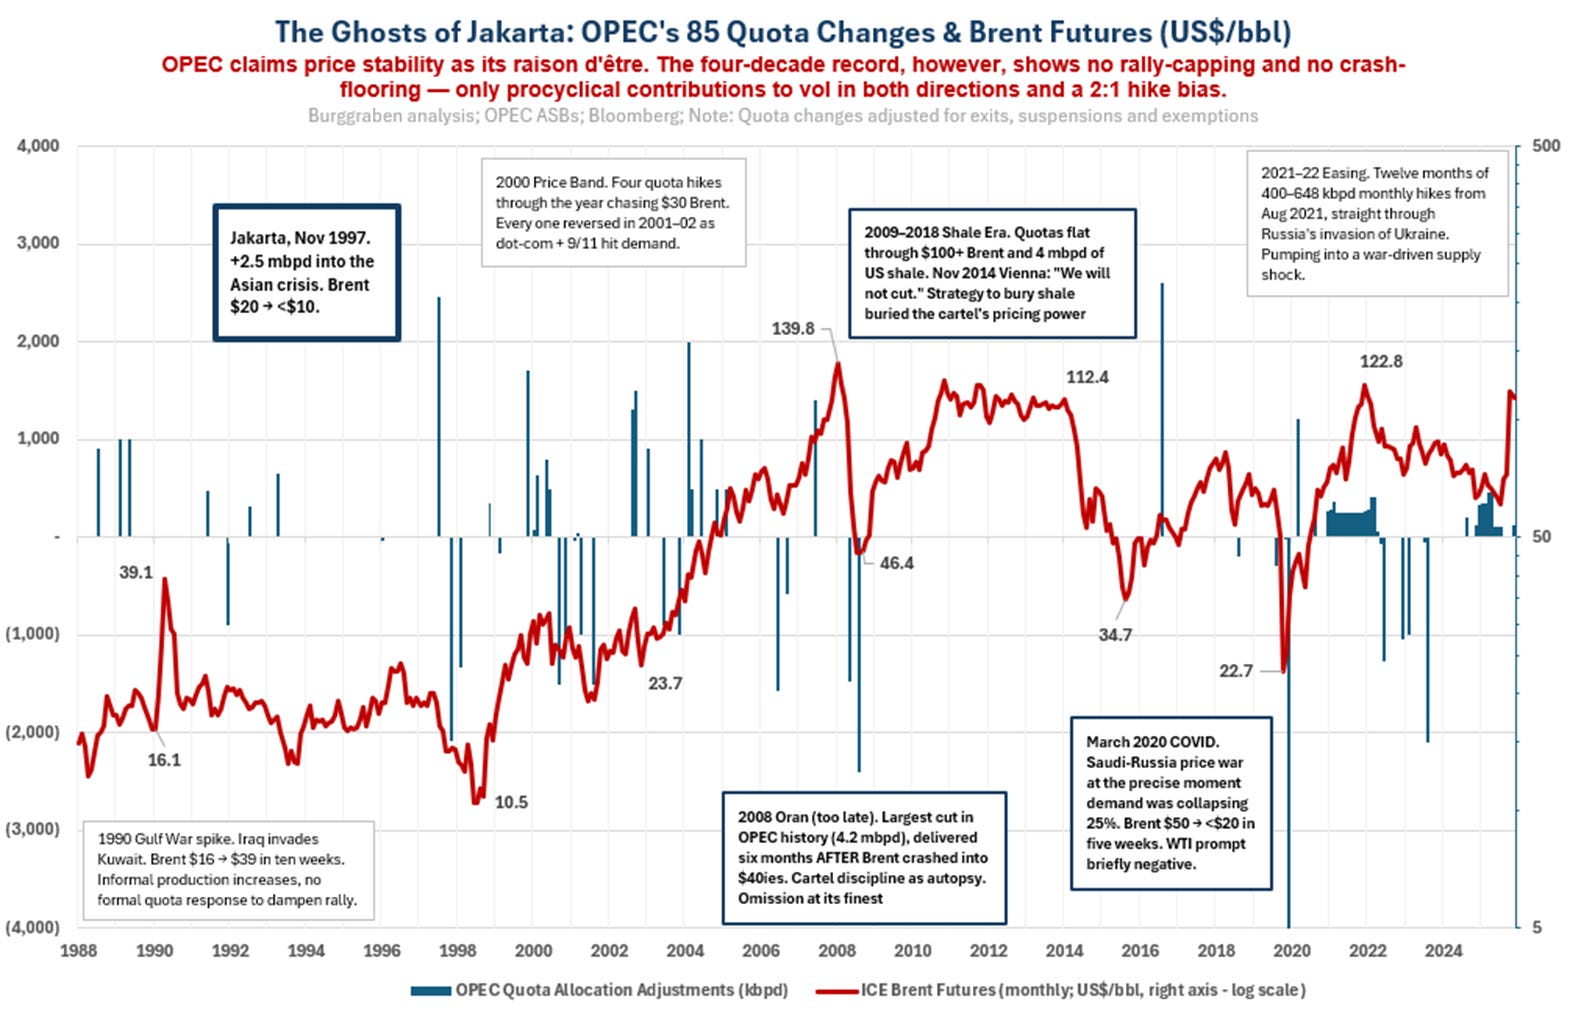
It is worth stating the inconvenient truth upfront. Despite decades of US presidents picking up the phone to Riyadh for every passing oil anxiety — from Nixon in 1973 to Biden’s fist-bump in 2022 — OPEC has never actually performed the price-stabilising role it claimed to perform. As we will show in detail below, the cartel’s monthly realised volatility under its watch has consistently run two to four times higher than the pre-OPEC Twin Cartel Era’s. The reverence Western capitals paid to the cartel for half a century rested on a function it never delivered. The UAE has now noticed.
As our volatility and quota-decision analysis below will show, OPEC has been a poor buffer of price swings and a dismal steward of oil markets for most of its history. Losing its smartest member changes the optics far more than the mechanics — beyond the 1.5mbpd the UAE will gradually add across 2027-28 once the Strait of Hormuz crisis normalises.
Let me explain.
2. Why Stable Oil Prices Matter
Oil sits at the core of the real economy, particularly in transport, where substitution is slow and scale effects dominate. When prices swing, they don’t just move profits around; they disrupt decision-making everywhere. Producers hesitate on long-cycle investments, airlines defer fleet choices, households rethink vehicles, and logistics firms second-guess fuel strategies. The uncertainty translates into underinvestment, misallocation of capital, weaker employment outcomes, and at the system level it propagates into inflation, financial conditions and policy responses.
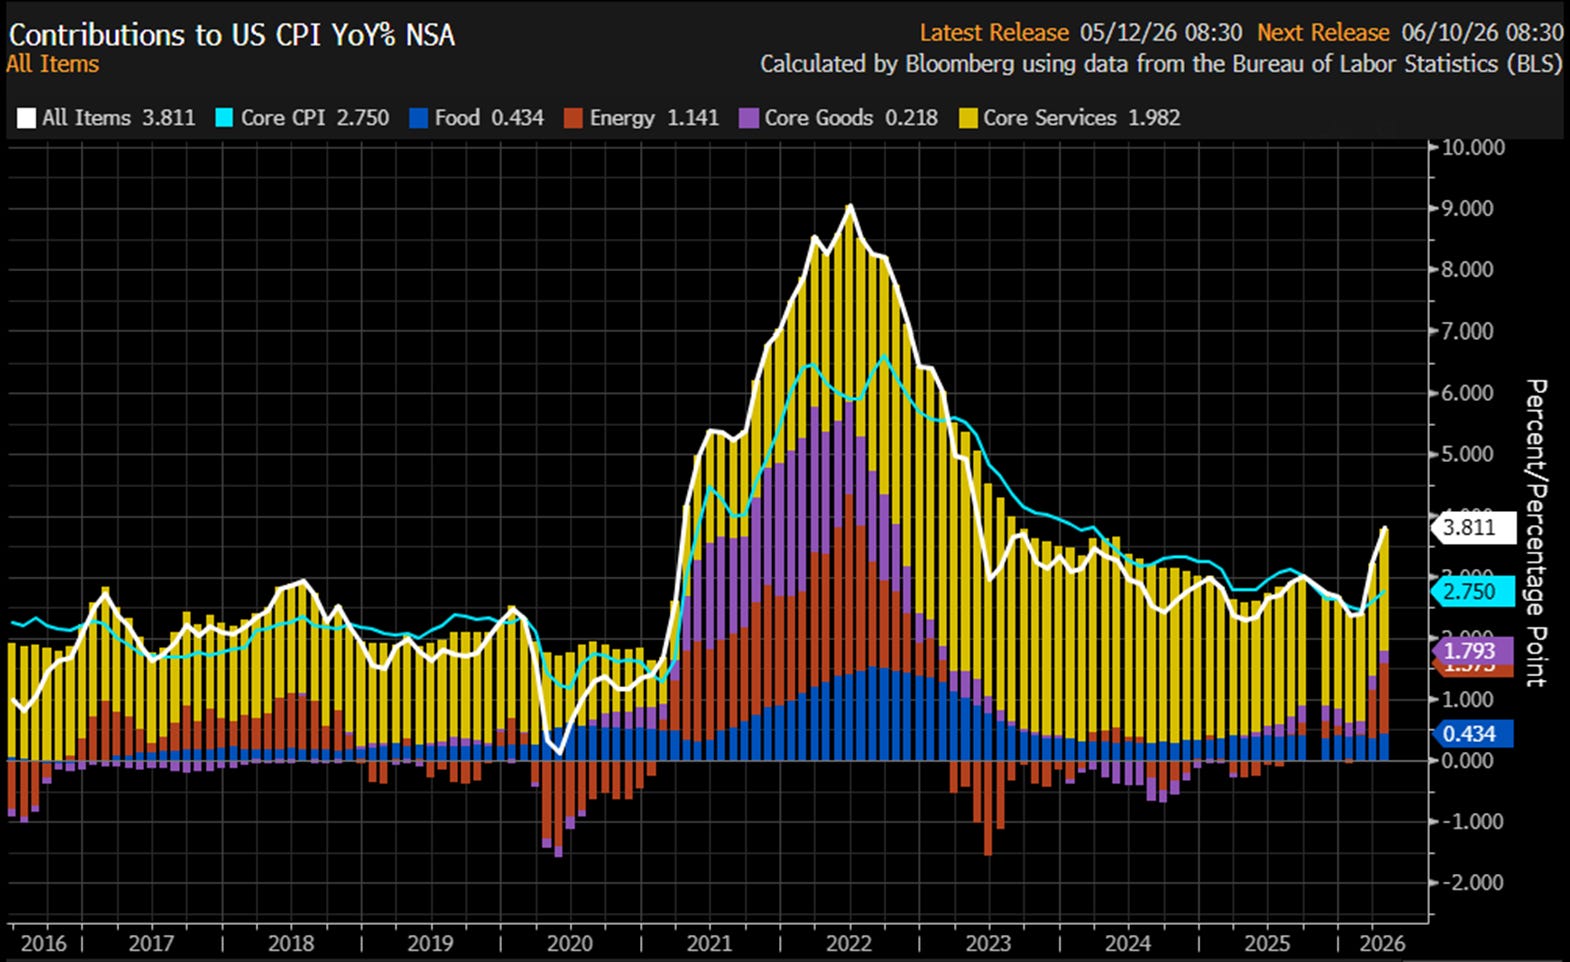
Oil moves quickly into headline inflation through fuel and transport, then bleeds into the core via freight costs, food prices, airfares and wage negotiations — as the two 1970s oil crises illustrated and as the March-April 2026 US CPI and PPI prints have re-illustrated for anyone who had forgotten. Central banks are then forced to respond to a supply-driven shock they cannot control, trying to hold inflation near 2% while a critical input price is gyrating.
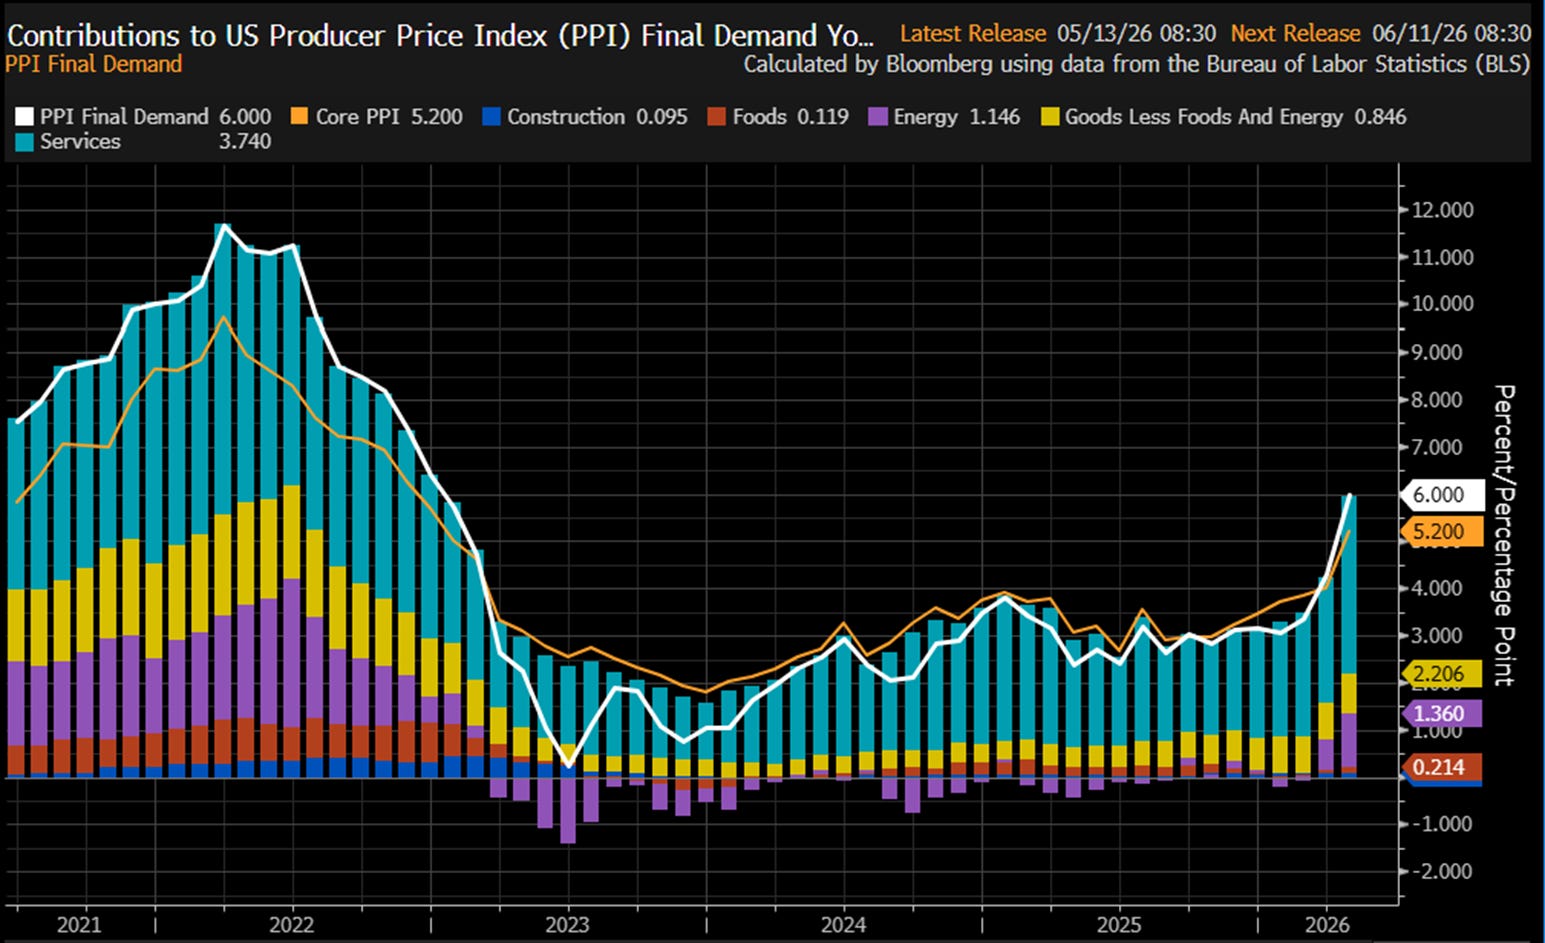
Stable oil prices dampen these shocks, anchor expectations, and give policymakers cleaner signals. The result is more predictable consumer behaviour, steadier wage setting, and more rational capital allocation. Seen in that light, efforts to smooth oil price volatility — including those by OPEC and earlier regulatory regimes — had a logic beyond simple cartel self-interest. Coordinated supply management could in theory reduce boom-bust cycles, limit fiscal crises in producer economies, and lower the risk of broader geopolitical spillovers.
But the historical record, which the rest of this piece walks through, is that dampening one of the largest sources of macro volatility remains illusive in the 21st century. Among other things, the world simply does not possess the supply-side spare capacity, the institutional discipline, or the political alignment to do so.
3. Historic Oil Price Volatility Regimes
In his book Crude Volatility, Bob McNally did the historical heavy lifting every serious oil analyst now stands on. We borrow his framework of distinct volatility eras and amend it where we disagree — his “Texas Era” becomes our “Twin Cartel Era”, because Texas alone never stabilised the world price; the Seven Sisters did half the work. With modern compute, we have also rebuilt the underlying price series and recalculated each era’s realised volatility from monthly, annual, and — where the data permits — daily returns.
Seven eras across oil’s 167-year industrial life: Boom-Bust I (1859-1881), the Rockefeller Era (1882-1911), Boom-Bust II (1912-1934), the Twin Cartel Era (1935-1970), OPEC Price Setting (1971-1986), OPEC Volume Setting (1987-2003), and Boom-Bust III (2004-present, where we currently sit).
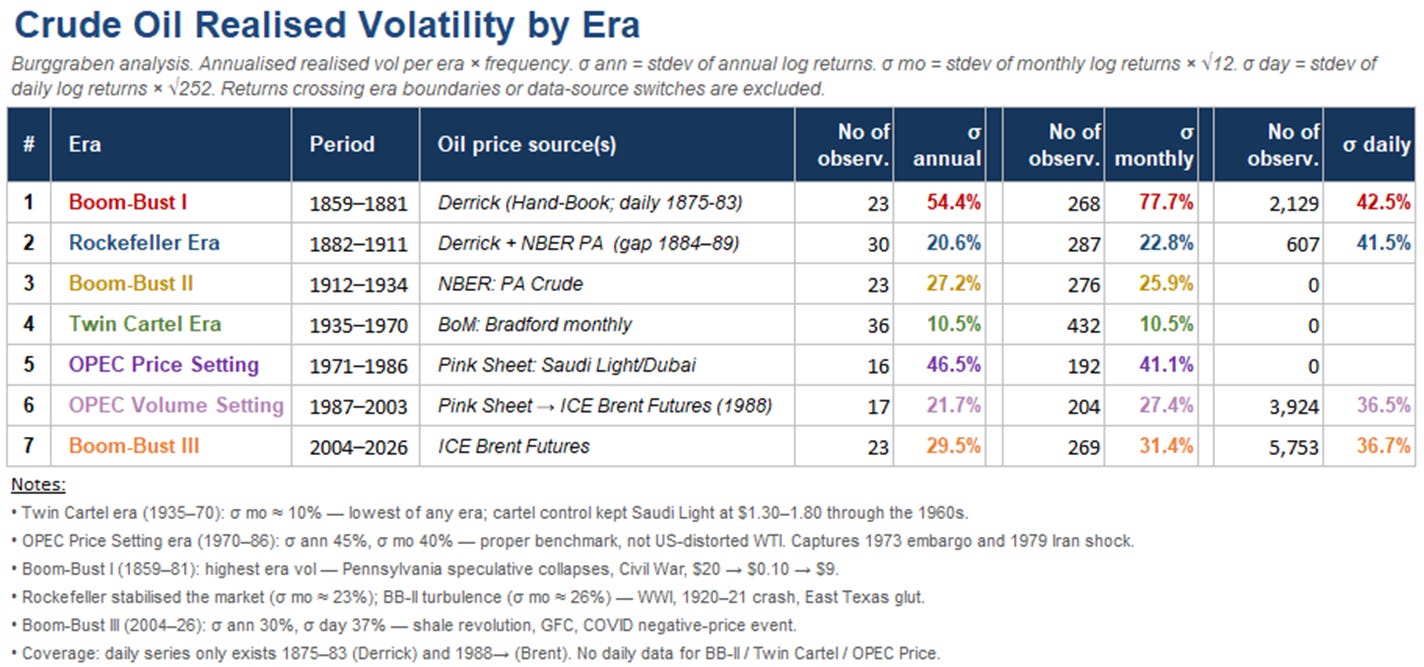
The data delivers a verdict that should make every OPEC apologist uncomfortable. Across 167 years, oil’s calmest stretch by a wide margin was the Twin Cartel Era of 1935-1970, when the Texas Railroad Commission and the Seven Sisters jointly throttled supply — σ monthly of just 10.5%, less than half of any other era. Saudi Light held between US$1.30 and US$1.80 for more than a decade. Those were the days of cheap international oil.
The moment OPEC wrestled the pricing pen away in 1971, monthly volatility nearly quadrupled to 41.1% and annual swings reached 46.5% — the most violent regime since the Pennsylvania speculative collapses of the 1860s and 70s. So much for the cartel’s self-styled role as market stabiliser.
OPEC’s forced pivot from price-setting to volume-setting after the 1986 price war brought relative calm (σ monthly 27.4%, σ annual 21.7%), but only because the cartel surrendered genuine price discovery to ICE Brent futures, launched in 1988. And here is the contrarian finding most analysts miss: across 1990-2003, oil’s annualised realised daily volatility averaged 36.5% — essentially identical to the 36.7% that has prevailed in the Boom-Bust era since 2003. The eye sees a sleepy decade in US$20 oil; the math sees a regime as turbulent as anything that came afterwards. Violent percentage moves on a US$20 base look invisible on a linear chart but compound to the same vol math as much larger dollar moves on a US$100 base.
Our current Boom-Bust III, now in its 22nd year, has delivered σ annual 29.5% and σ daily 36.7% — shale’s productivity revolution, the GFC demand shock, and COVID’s negative-price moment together rank this era as the third most volatile in oil’s history, behind only Boom-Bust I and the OPEC Price Setting decade.
The pattern is unambiguous: tightly held supply arrangements (Rockefeller, Twin Cartel) deliver low volatility; competitive supply shocks and OPEC’s heavy-handed pricing experiments deliver chaos. OPEC’s brand as the world’s swing producer survives more on press releases than on the standard deviation of returns.
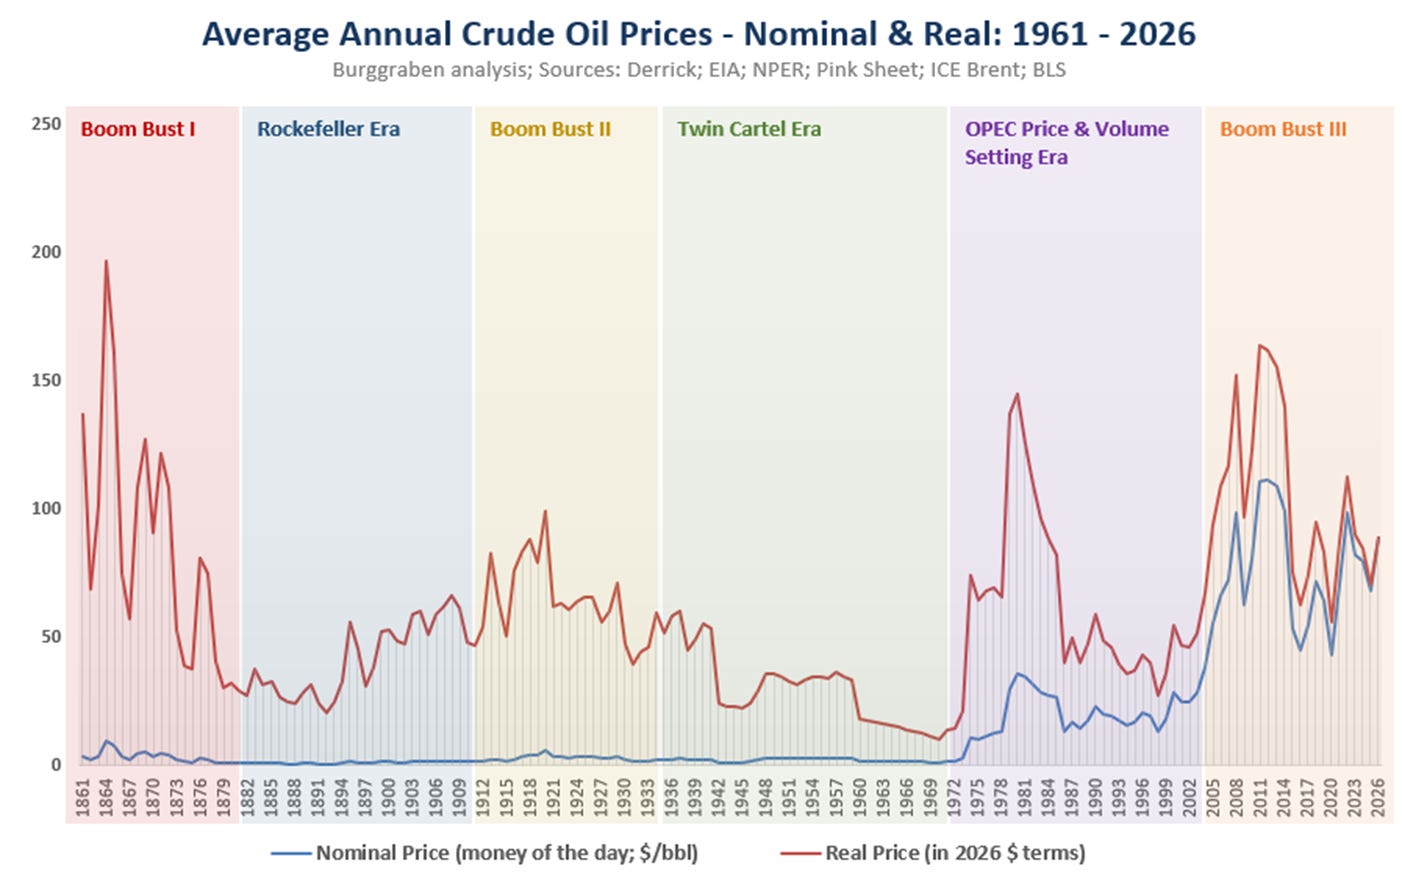
Let’s look at these eras now.
4. Boom-Bust I (1859-1881)
Right out of the gate of oil’s commercial discovery, the problem of having too much or too little of it established itself.
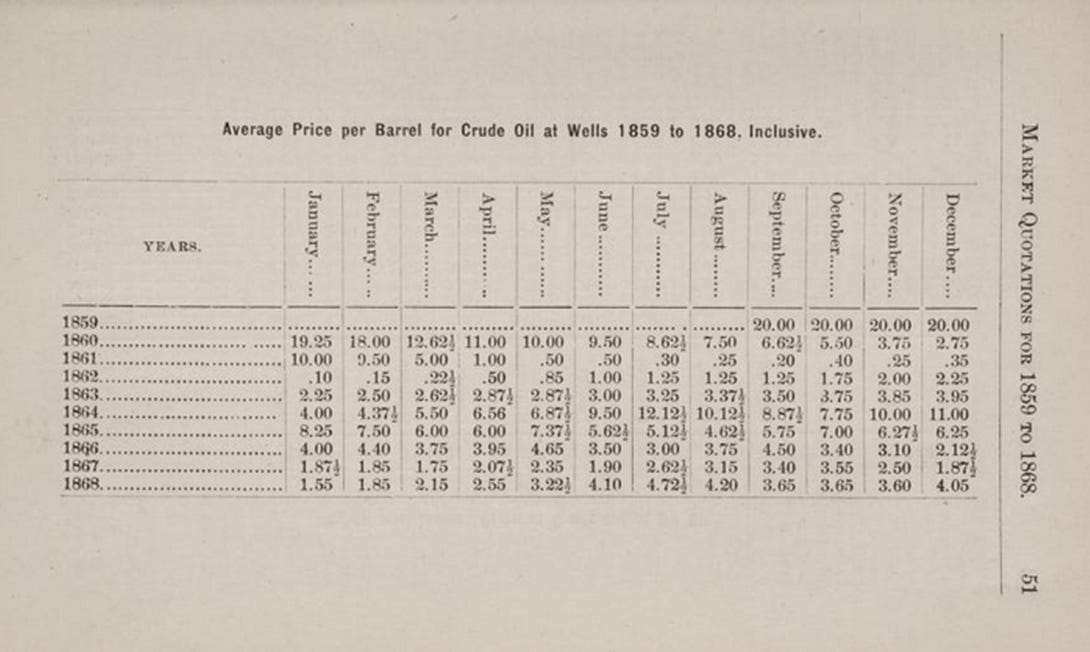
From December 1859 to January 1862, oil prices in the United States crashed from US$20 to as low as 10 cents per barrel, forcing many oilmen to close their operations. That is a 99.5% bust in two years, and it was the first of many epic price collapses in oil’s history. With each new field discovered, the market was instantly oversupplied — crude oil production exceeding storage and transportation capacities — and prices collapsed before the next discovery did it again. Unlike soft commodities, oil cannot simply be destroyed or left to spoil; it sits in the ground until someone builds the infrastructure to handle it.
From 1859 to 1875, average monthly volatility ran at 111% (and would have been higher with daily data), according to The Derrick’s Hand-Book of Petroleum published in 1889. The greatest stretch of price chaos the commodity would ever know.
5. The Rockefeller Era (1882-1911)
Drillers tried to cartelise themselves out of the chaos. They failed.
The Oil Creek Association of 1861, the Petroleum Producers’ Association of 1869, the various shutdown movements through the 1870s — all collapsed for the same reason any voluntary supply pact does: the more it works, the bigger the prize for the cheater and the holdout. With thousands of independent operators, low barriers to entry, and a new gusher always around the corner, upstream discipline was a lost cause.
Enter John D. Rockefeller. His insight was that the choke-point was not at the wellhead but downstream and midstream. Refining required real capital and operational skill, unlike wildcatting. Transportation — railroads first, then long-haul pipelines — was a genuine oligopoly, unlike oil resources, which in the United States (unlike most places globally) belonged to whoever owned the land. There were countless such owners.
Rockefeller squeezed both. Through aggressive railroad rebate deals, predatory pricing, secret acquisitions and the 1882 Trust structure devised by his lawyer Samuel Dodd, Standard Oil controlled more than 90% of US refining capacity by 1879 and effectively dominated the pipeline grid through the 1880s to 1911. He never directly set the crude price. He did not have to. By adjusting storage tariffs, refusing to lift excess barrels through his pipelines, and at times curtailing his own refinery runs, he could reach back down the supply chain and force drillers to throttle. When pressure failed, he occasionally just cut a deal — the 1887-88 “Great Shutdown” being the most successful voluntary supply cut of the era.
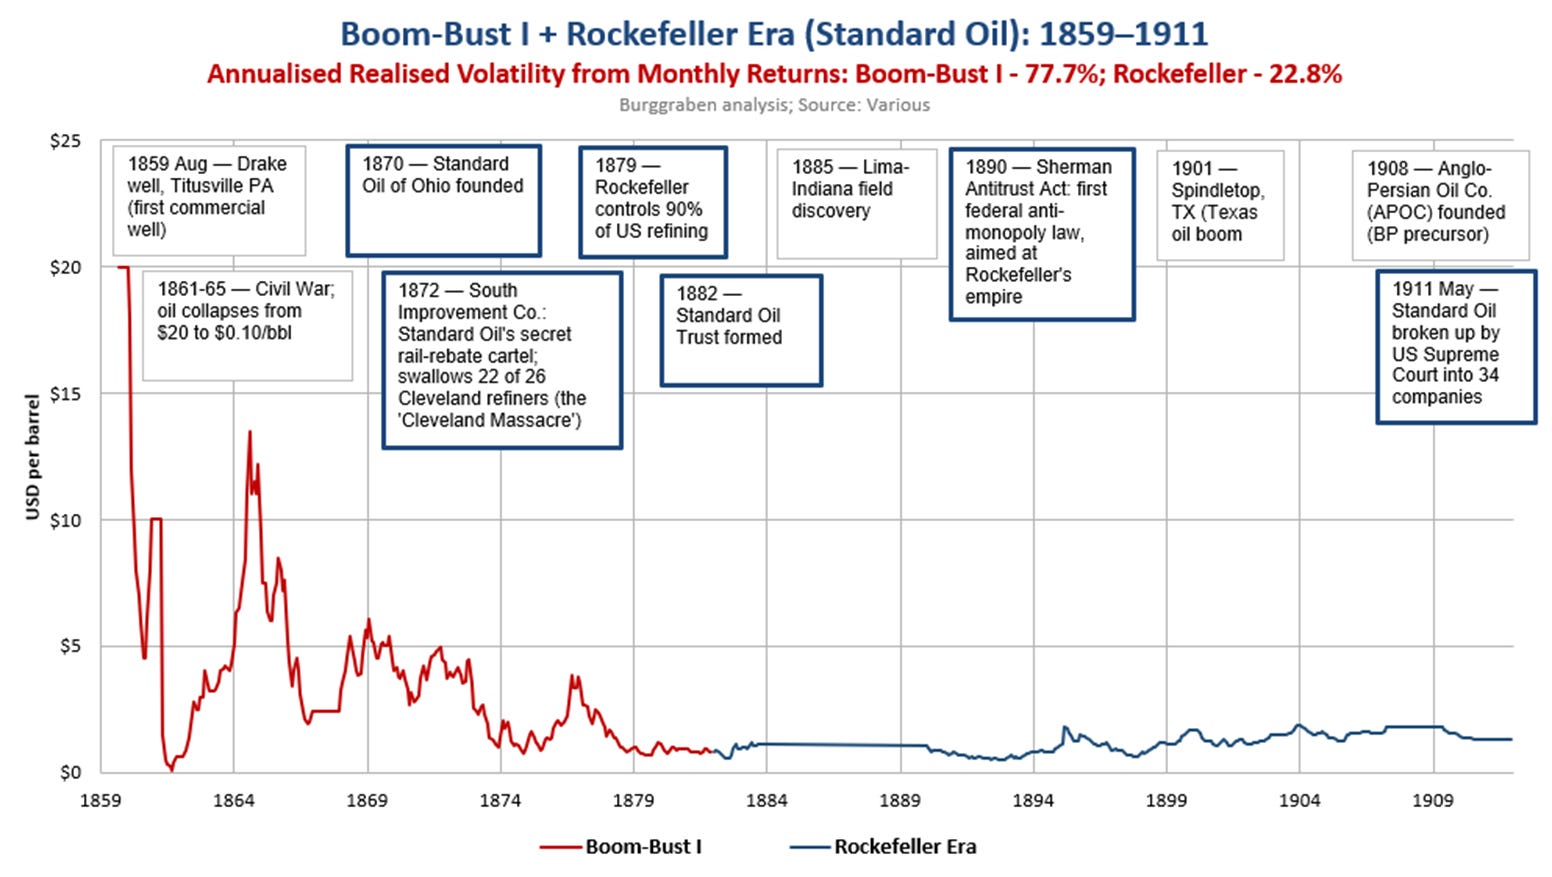
The results speak for themselves. Average annual price volatility collapsed from 78% in Boom-Bust I to 23% under Rockefeller — the first sustained period of price stability the industry had ever known. And it was not just stability for stability’s sake: kerosene retail prices fell from roughly 45 cents per gallon in 1863 to about 6 cents by the mid-1890s. Stable and disinflationary, which is largely why the public tolerated the monopoly as long as it did.
On 15 May 1911, Standard Oil was found guilty of violating the Sherman Antitrust Act and was forced to break up within six months. Rockefeller retired but retained his original share ownership in every one of the new spin-offs — anti-trust did not mean expropriation. The asset-light architecture of the breakup made him wealthier still: the combined value of the resulting Standard Oil descendants rose fivefold over the next decade.
6. Boom-Bust II (1912-1934)
The 1911 dissolution didn’t just remove the stabiliser — it coincided with a complete rewiring of the demand side. Gasoline overtook kerosene as the most prized refined product in 1910, the Model-T was three years old, and oil’s strategic role for navies and armies was about to be cemented by the First World War.
On the supply side, the discovery treadmill never stopped: Spindletop (1901), Glenn Pool (1905), Cushing (1912), Healdton (1913), the Los Angeles basin in the 1920s, and finally East Texas in 1930. Bigger industry, same pathology. The price pattern repeated almost mechanically as it had in Boom Bust I. WWI demand sent mid-continent crude from US$1.30 in March 1915 to US$6.10 in March 1920 — a 452% jump that would not be exceeded for fifty years. Then California’s new fields came on, supply overwhelmed everything, and prices nosedived from US$6.10 at the start of 1921 to US$2.25 six months later. The full boom-bust cycle, compressed into a single business cycle.
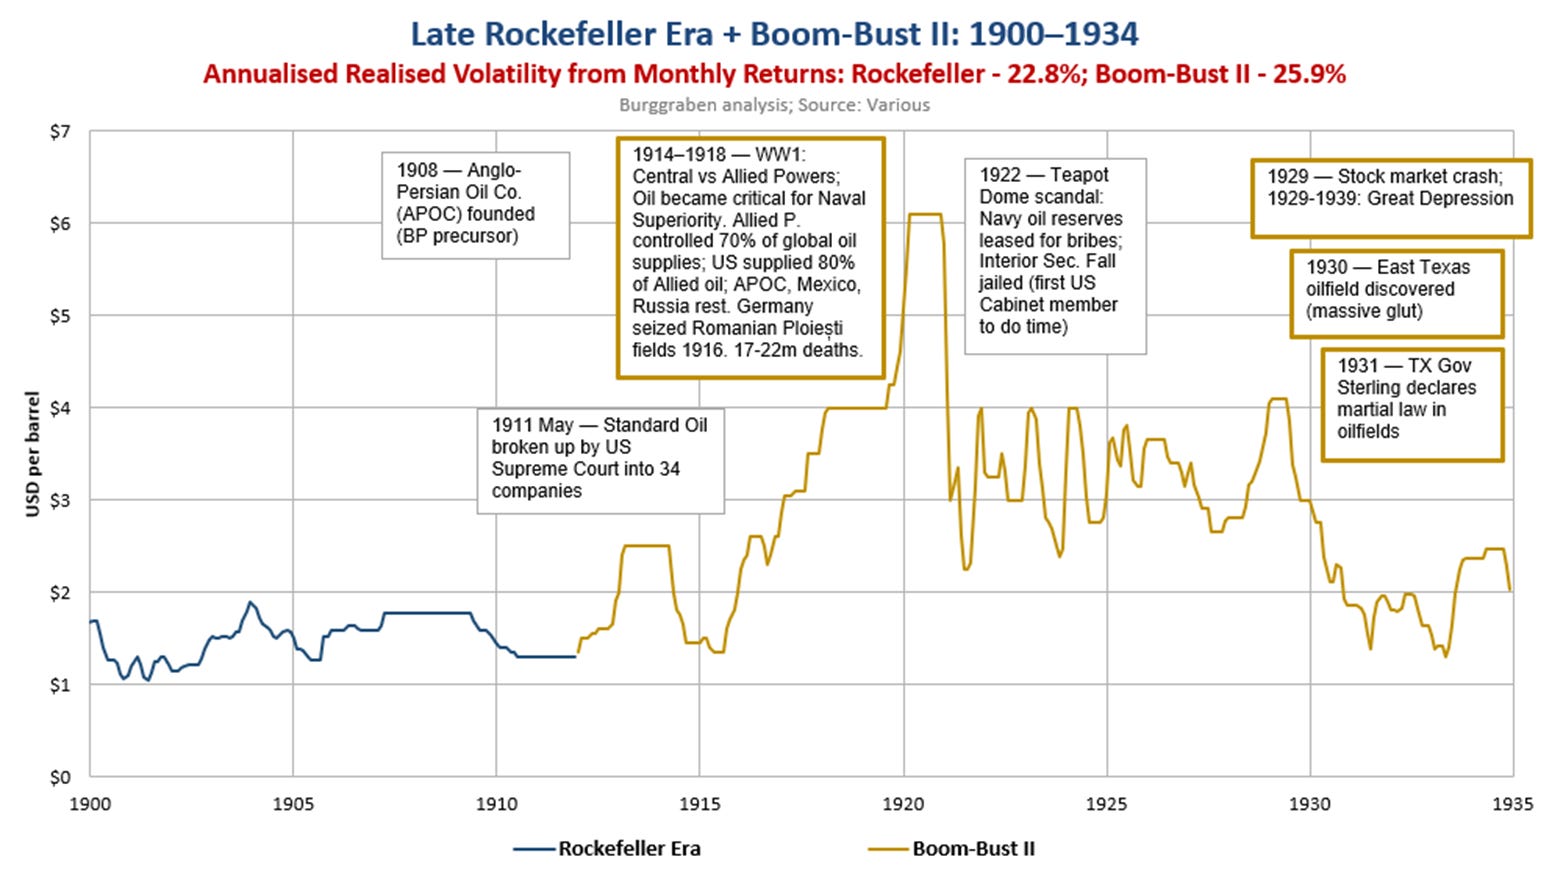
Stabilisation efforts ran on two tracks. Domestically, state officials tried to step in where Rockefeller’s trust no longer could: the Oklahoma Corporation Commission issued the first “proration” orders on the Healdton and Cushing fields in May 1914, Texas followed in 1919 with a Texas Railroad Commission given limited authority over physical waste — but the early quotas were toothless.
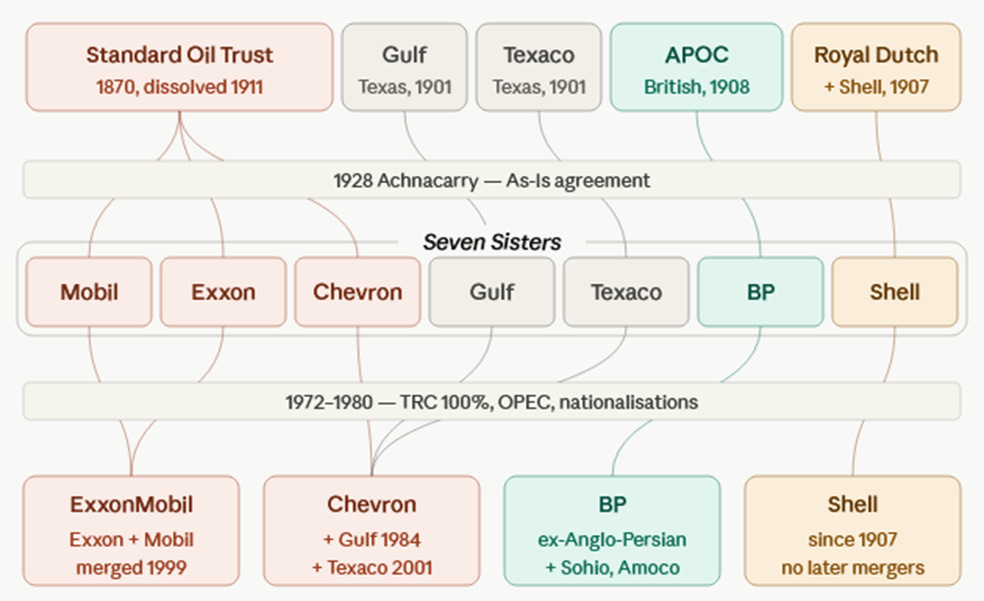
Internationally, in August 1928, Walter Teagle of Standard Oil of New Jersey, Sir John Cadman of Anglo-Persian, and Sir Henri Deterding of Royal Dutch Shell met for two weeks of scotch, grouse-shooting and negotiation at Deterding’s Achnacarry Castle in Scotland, and signed an “As-Is” Agreement freezing global market shares at 1928 levels. The Red Line Agreement that July had already carved up the former Ottoman oil territories among the same group plus partners. Both were private treaties between the majors. Both held — for a while.
Average price volatility came in around 26% — much better than the 78% of Boom-Bust I, but only because the industry was now bigger, more interconnected, and faster at moving barrels. The structural problem was unchanged: massive new finds, sticky demand, the rule of capture, and no domestic entity with the authority or scale to choke flow.
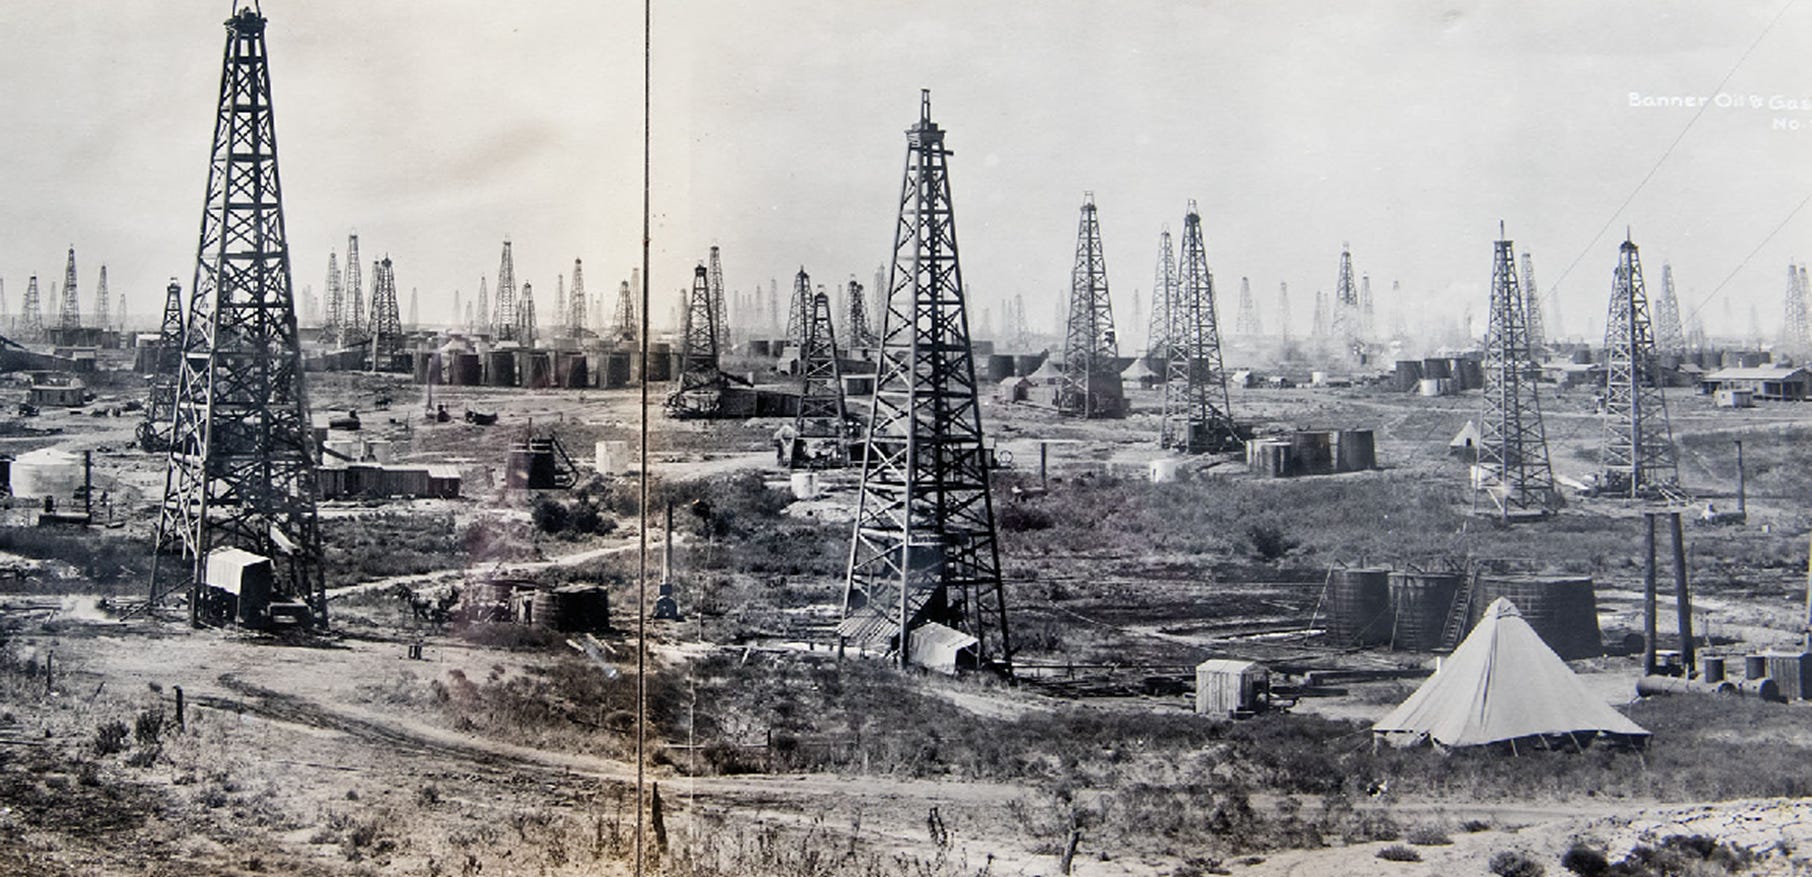
Stability would have to wait for the Texas Railroad Commission to discover what it was really capable of — which happened sooner than anyone expected when, on 3 October 1930, a 70-year-old wildcatter named Columbus “Dad” Joiner brought in his Daisy Bradford No. 3 well in Rusk County and triggered the East Texas field, the largest oil discovery in American history to that point. It would produce more than 5.4 billion barrels between 1931 and 1980.
7. The Twin Cartel Era (1935-1970)
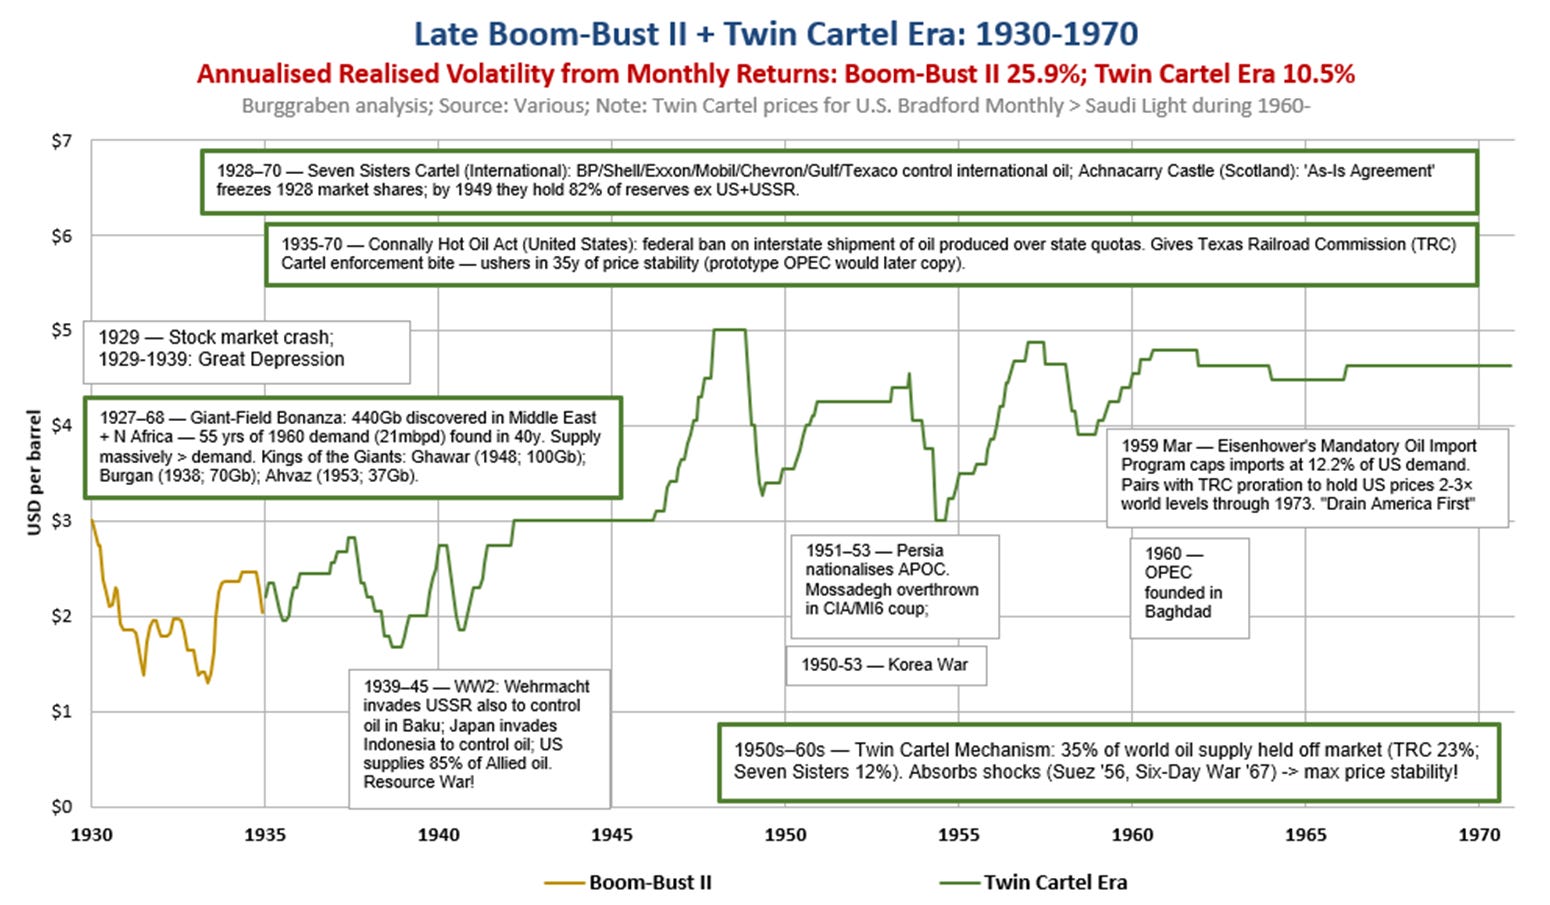
The problem of price volatility never really went away — to this day — except for one 35-year stretch when oil traded essentially range-bound between US$2 and US$5 a barrel, with annual volatility as low as 10% between 1935 and 1971. McNally calls this the “Texas Era,” which is half-right. From a global perspective it is better described as the Twin Cartel Era: US stability administered by the Texas Railroad Commission (TRC), international stability administered by the Seven Sisters, with Eisenhower’s import quotas welding the two systems together. Each cartel needed the other to work.
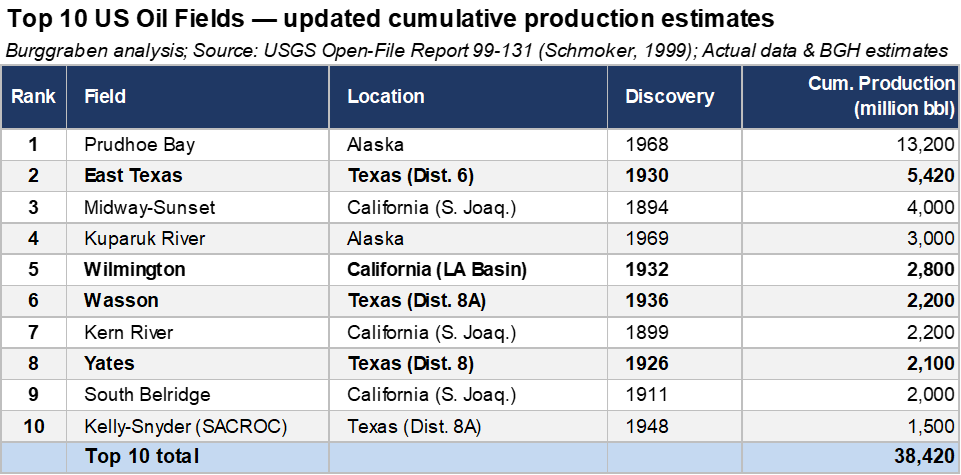
The TRC version began with the crisis Dad Joiner had just delivered. The “Black Giant” (the East Texas Field) was a 220-square-mile contiguous reservoir that within nine months was producing one million barrels per day from thousands of wildcat wells, and East Texas crude duly crashed from US$1.00 to US$0.10 a barrel by July 1931. Between 1926 and 1936, wildcatters discovered 4 of the 10 largest conventional oil fields in the United States. That required drastic measures. Texas delivered them.
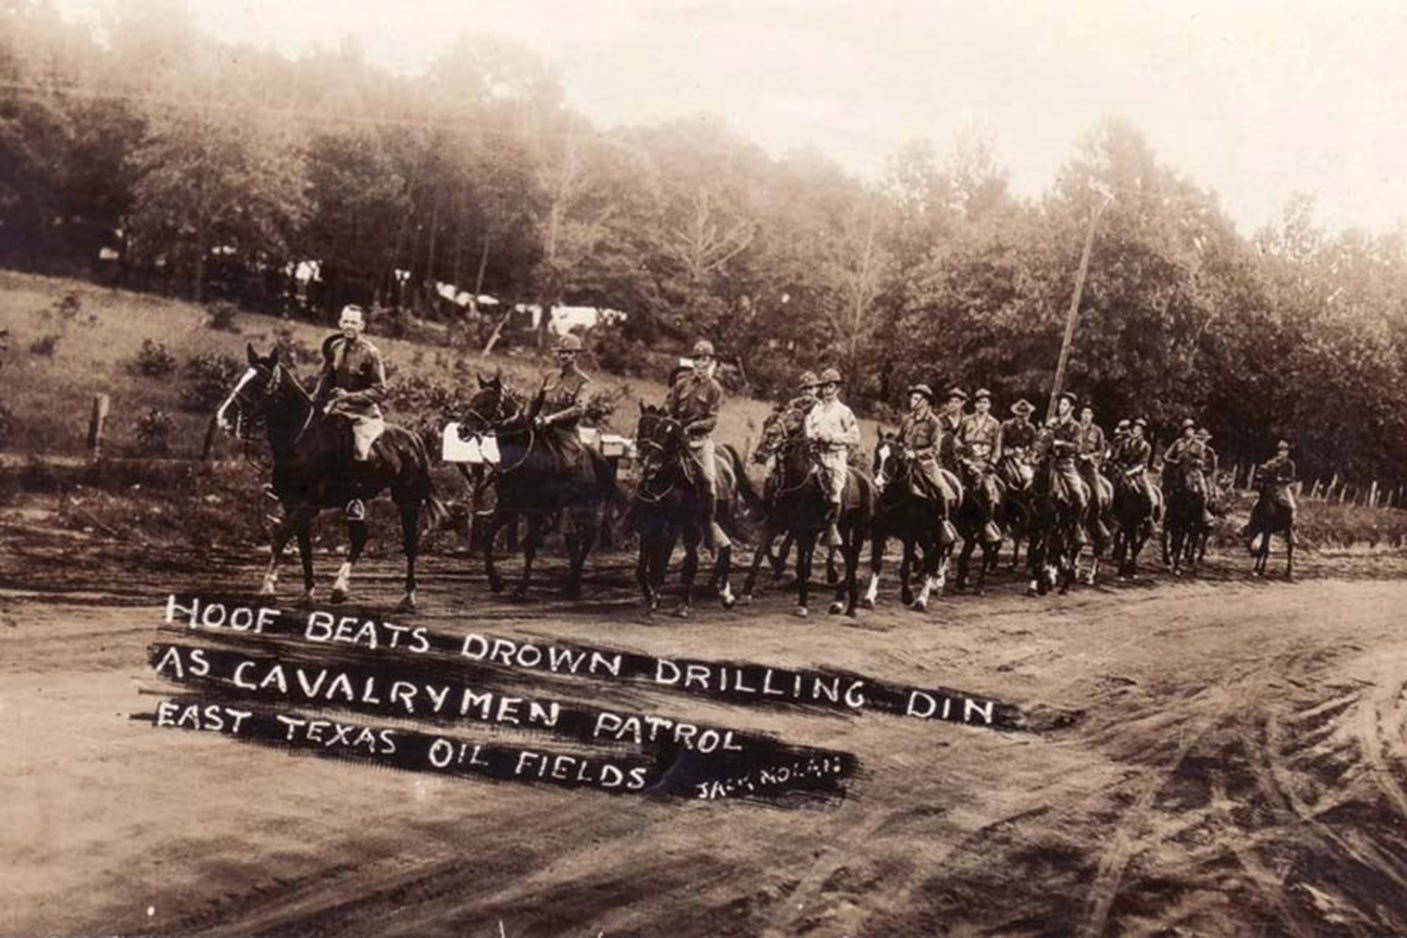
On 17 August 1931, Governor Ross Sterling declared martial law and ordered 1,200 men of the Texas National Guard’s 56th Cavalry Brigade into the field to physically shut wells in. They stayed there until the courts forced them out, by which point Austin had figured out how to do it with regulators instead of soldiers. The 1935 Connally Hot Oil Act criminalised interstate transport of oil produced over quota, the Interstate Oil Compact extended the model across the major oil states, and from then on the TRC ran a monthly “allowable” system: forecast demand, set quotas, swing US output to fit. It worked for 35 years.
Internationally, the Seven Sisters did the same job through different means. Achnacarry and the Red Line had already laid the framework in 1928 — frozen market shares, jointly-owned concessions, “self-denying” clauses preventing independent development. The Seven Sisters — namely Anglo-Persian Oil Company (BP), Royal Dutch Shell, Esso (Exxon), Mobil, Chevron, Gulf, and Texaco — between them controlled around 85% of global reserves outside the US, USSR and Mexico, and they didn’t need quotas because they owned the wells outright. Their concessions across the Persian Gulf, Indonesia and Venezuela meant they could decide how much each host country produced, post a price benchmarked to US Gulf crude, and call it a market.
Their political reach was on display in 1953, when the CIA and MI6 jointly engineered the coup against Iran’s Prime Minister Mossadegh to reverse his nationalisation of Anglo-Persian Oil Company (BP) and force the British monopoly open into a consortium that included the Americans.
The result was the calmest oil market in history. Annualised volatility collapsed to 10.5% between 1935 and 1971 — roughly 8x quieter than the boom-bust eras either side of it. Between 1948 and 1970, US crude prices held a US$3-5 band. Monthly Arab Light, quoted in the World Bank’s Pink Sheet between January 1960 and December 1971, hovered between US$1.21 and US$1.74 — less than half its American equivalent. For a brief period in history, oil had become a utility — for the benefit of the post-war development of Western economies.
Why two prices? In 1959, President Dwight D. Eisenhower established the Mandatory Oil Import Quota Program to restrict the volume of foreign petroleum entering the United States at 12.2% of US demand. The primary goal was to safeguard national energy security by preventing dependence on vulnerable foreign supplies, while also protecting the domestic oil industry from cheaper global competition — competition the Seven Sisters had been discovering at an unprecedented pace.
It is almost impossible to grasp the market power the Seven Sisters held in their prime. A staff report by the Federal Trade Commission on “The International Petroleum Cartel” in August 1952 explained the scale. They controlled substantially all production and reserves outside the United States and the USSR — what I call the Free World Reserves. By 1944, with the world’s first publicly disclosed country-by-country reserve figures laid before Senator Truman’s committee, the seven companies already controlled 59.3% of Free World reserves while pumping just 17.4% of Free World output. By 1955 their share of reserves was 78.5%, ex United States.
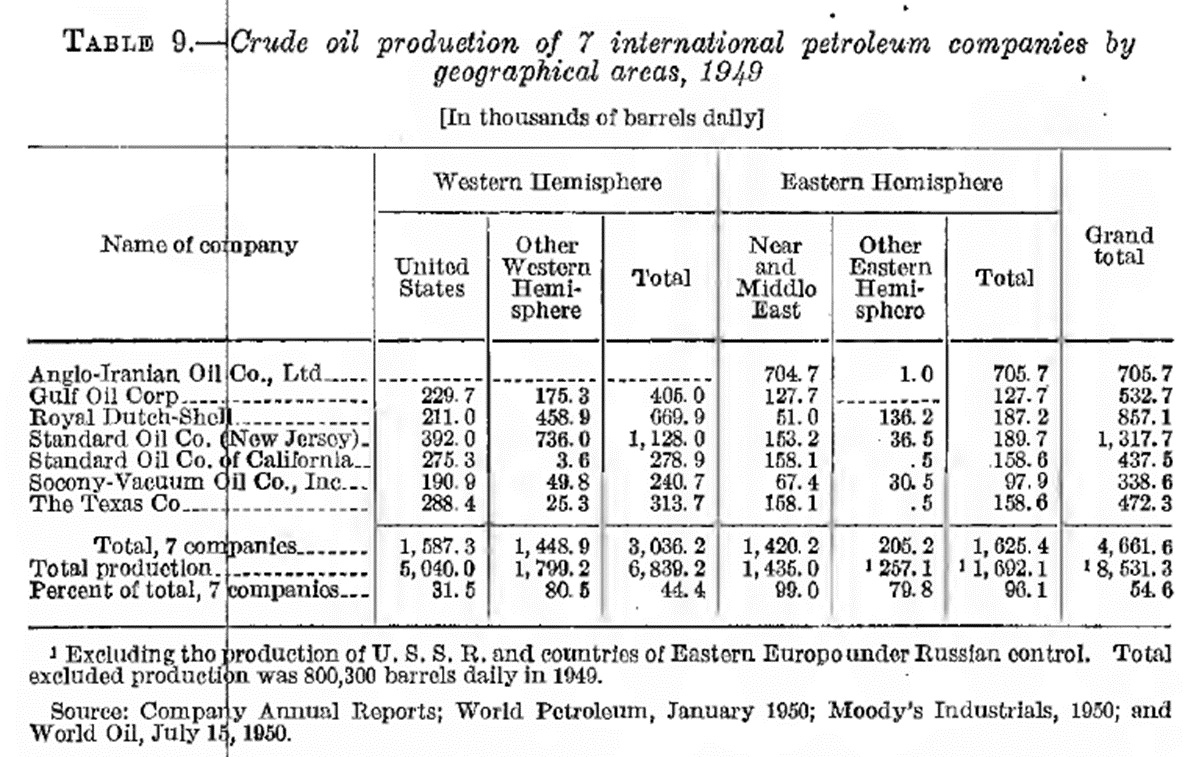
Perhaps the most interesting observation is what I call the spread between their reserve-to-production (R/P) ratio internationally versus that observed for the United States: it peaked at 68.2x versus 12.1x in 1955. The measure is a way of illustrating the Seven Sisters’ spare production capacity mainly in the Middle East, what I like to call “latent spare capacity”. The Sisters could have easily tripled their output within a relatively short timespan with modest capital. But why repeat the mistakes made during Boom-Bust I with every new giant field discovery in the Middle East and with a set rule of global market share in place?
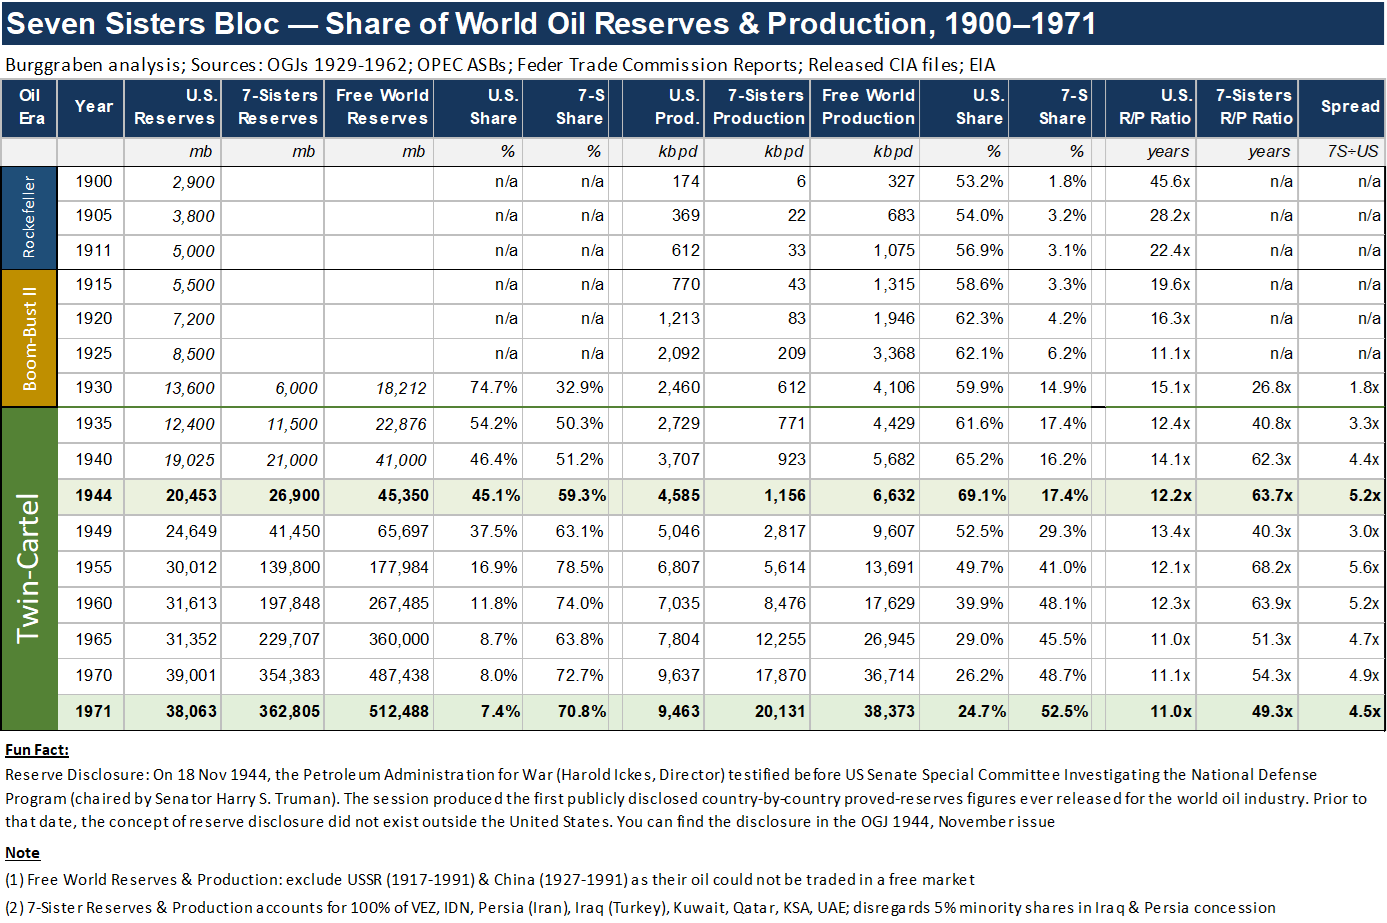
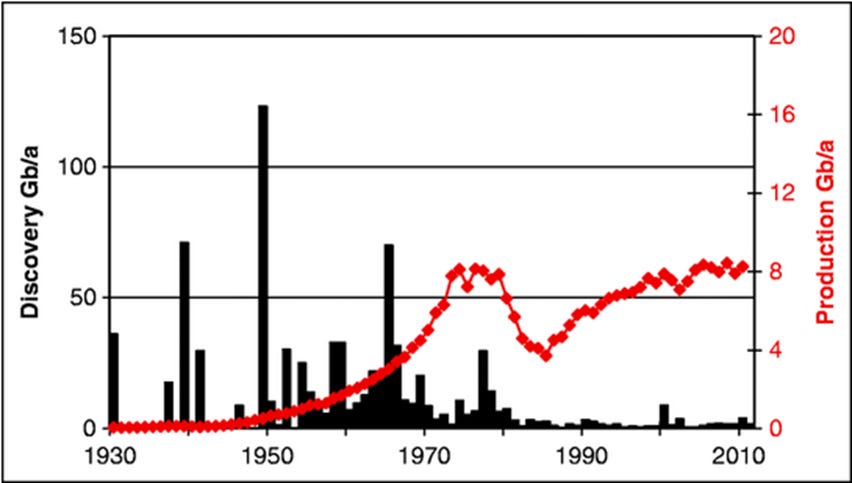
In the four decades they sat astride the global oil concession, the Seven Sisters added roughly 351 billion barrels to their reserve base — a thirty-one-fold expansion against the US industry’s three-fold — while quietly absorbing the largest sequence of giant-field discoveries in human history: Kirkuk (1927), Burgan (1938), Dammam (1938, the discovery well that pointed to Ghawar), Ghawar itself confirmed in 1948, Rumaila (1953), Safaniya (1951). Five of the ten largest oil fields ever found were brought into the Sisters’ concession portfolio in a span of twenty years, and almost everything that still matters to global supply in 2026 — Ghawar, Burgan, Safaniya, Kirkuk, Rumaila — was on their books before the first OPEC quota was ever set.
As McNally documents from the 1928 Achnacarry minutes, the Sisters’ own internal estimate was that “world shut-in production amounts to 60% of the production actually going into consumption.” This was the deliberate management of an oil glut: an era when annual demand growth ran below the pace of new discovery, and where the cartels’ job — both the TRC in Texas and the Sisters abroad — was not to find more oil but to keep what had been found from drowning the price.
The system did exactly what it was designed to do, and the Western consumer was the beneficiary: 35 years of cheap and stable oil underwrote the post-war industrial miracle. But the wealth transfer that followed its collapse deserves to be named plainly. The nationalisations of 1972 (Iraq), 1975 (Kuwait), 1976 (Venezuela), and 1980 (Saudi Aramco) expropriated concession assets that had been developed under contracts running 60 years or longer, financed and de-risked entirely by the majors, with host-government royalties already restructured to a 50/50 profit split since 1948.
By any standard of contract law these were illegal seizures and forced sellouts, and in any other decade Washington or Westminster would have responded as they had in Mexico in 1938 or Iran in 1953. But the host governments were spectacularly lucky in their timing. Britain had been politically broken by Suez in 1956 and economically broken by sterling’s 1967 devaluation; the United States was distracted by Vietnam, the August 1971 closing of the gold window, and a domestic political crisis that would end in Watergate. The pricing baton did not so much pass as get dropped — and the producing countries picked it up.
Three things guaranteed price stability during the Twin Cartel era: (a) annual demand growth was smaller than new discoveries, so there was always a glut to manage; (b) the TRC monopolised US supply while the Sisters cartelised the rest, with Eisenhower’s 1959 Mandatory Oil Import Quotas welding the two systems together; and (c) the duo together held enough global spare capacity to absorb any shock without breaking the price stability.
Three things guaranteed price stability during the Twin-Cartel era: (a) annual demand growth was smaller than new discoveries, so there was always a glut to manage; (b) the TRC monopolised US supply while the Sisters cartelised the rest, with Eisenhower’s 1959 Mandatory Oil Import Quotas welding the two systems together by walling off the domestic market from international competition; and (c) the Cartel duo together held enough global spare capacity to absorb ANY kind of shock without breaking the price stability.
If you value deep, proprietary research — the kind that takes weeks rather than tweets and that almost no financial publication still bothers to produce — please support it by becoming a paying subscriber. What follows is the actual work: the 1970s post-mortem, the country-by-country compliance audit assembled from forty-three years of OPEC bulletins, the six great quota mistakes, and the verdict on what comes next. Going the Extra Mile only happens when readers go the extra mile too.